
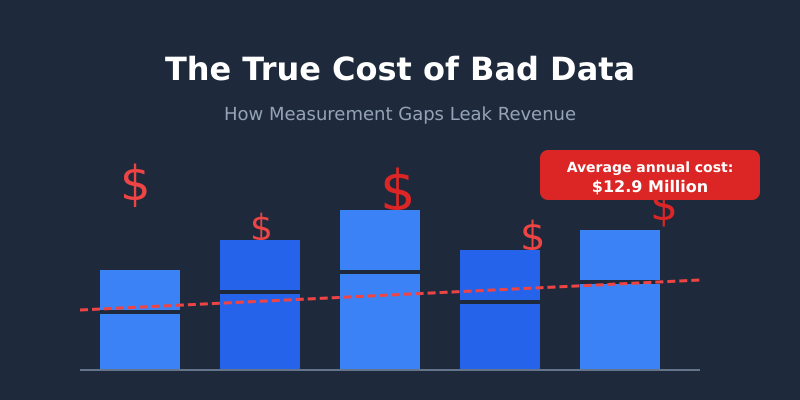
Gartner estimates that poor data quality costs organisations an average of $12.9 million annually. That number sounds dramatic until you realise it’s actually conservative. The real damage isn’t in the errors you catch — it’s in the decisions you never realise are wrong.
I learned this first-hand during my time as a Senior Analyst at Tesco. We discovered that a seemingly minor tracking discrepancy in our loyalty card data was silently inflating the performance of one product category by 18%. The marketing team had been over-investing in that category for months, diverting budget from categories that were genuinely growing. The cost of bad data wasn’t just the wasted spend — it was the missed opportunity that compounded every single week.
If you’re a CFO, CMO, or anyone who signs off on budgets based on analytics dashboards, this article will show you exactly where your data is likely leaking revenue — and what to do about it.
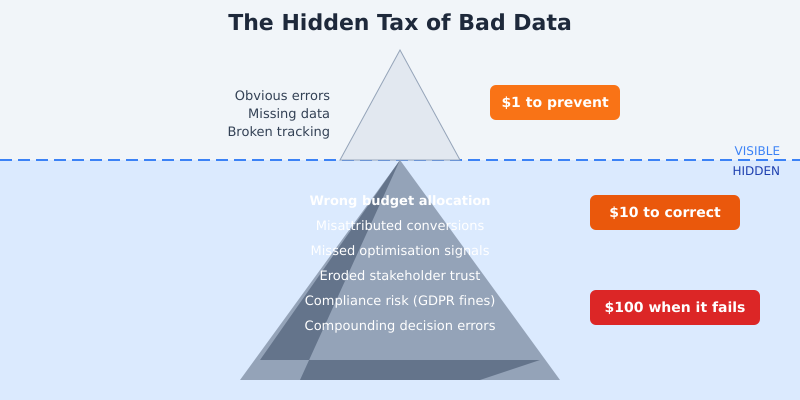
The Hidden Tax of Bad Data
Most organisations treat data quality as a technical problem. Something for the analytics team to worry about. But bad data is a financial problem, and it follows a predictable pattern of escalation that IBM’s research famously captured as the 1-10-100 rule: it costs $1 to prevent a data error, $10 to correct it after the fact, and $100 to absorb the impact when it reaches a business decision.
Think about that multiplied across every marketing campaign, every board report, every quarterly planning session. A study from MIT Sloan Management Review found that knowledge workers waste up to 50% of their time dealing with data quality issues — hunting down discrepancies, reconciling conflicting reports, and second-guessing numbers they don’t trust.
The worst part? Bad data compounds. One flawed assumption feeds into the next decision, which feeds into the next quarter’s strategy. By the time someone catches the error, you’ve built an entire strategy on a foundation of sand.
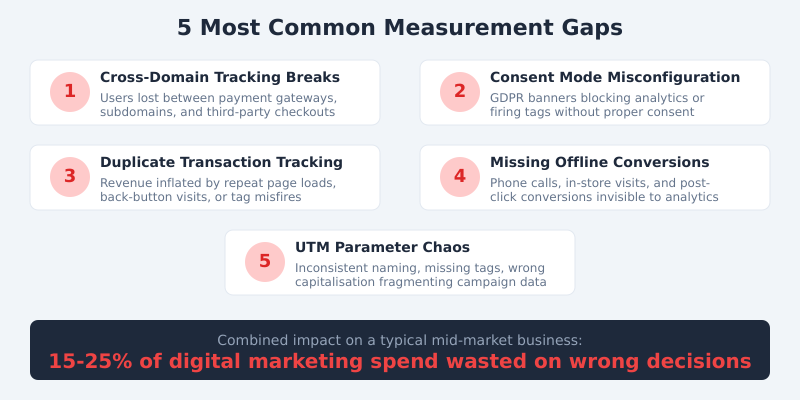
The 5 Most Common Measurement Gaps
After 15 years of auditing analytics setups — from FTSE 100 firms to high-growth startups — I see the same five problems again and again. Each one silently distorts the numbers your team relies on to make decisions.
1. Cross-Domain Tracking Breaks
Every time a user crosses from your main site to a payment gateway, subdomain, or third-party booking engine, there’s a risk of losing their session. When that happens, a single customer journey gets split into two or three separate “visitors” in your analytics. Conversions get misattributed. Traffic sources go dark.
At Deliveroo, fixing cross-domain tracking between our restaurant partner pages and the main checkout flow revealed that organic search was driving 23% more conversions than we’d previously measured. That insight shifted a six-figure budget allocation.
2. Consent Mode Misconfiguration
GDPR compliance is non-negotiable. But I’ve audited sites where the Google Consent Mode implementation was either blocking all analytics tags (losing 40-60% of data) or — worse — firing marketing tags before consent was given, creating legal exposure. Getting this right means you capture the maximum amount of data while staying compliant with ICO regulations.
3. Duplicate Transaction Tracking
This is the silent killer. A customer completes a purchase, then hits the back button, or refreshes the confirmation page, or opens the order confirmation email link. Without proper deduplication logic, that single transaction fires two or three times in your analytics. Revenue figures get inflated. ROAS looks better than it is. And you keep spending on channels that aren’t actually performing.
4. Missing Offline Conversion Data
During my time at Barclays, I worked on connecting online research behaviour with branch-level conversions. The gap was staggering — roughly 35% of mortgage applications that started online were completed in-branch, but our digital analytics showed those users as “bounced” or “unconverted.” If you sell anything where the final conversion happens offline — phone calls, in-store visits, B2B sales meetings — your online data is telling half the story at best.
5. UTM Parameter Chaos
I’ve seen campaigns tagged as utm_source=Facebook, utm_source=facebook, utm_source=fb, and utm_source=FB_Ads — all within the same month, all from the same team. Each variant creates a separate line item in your reports, fragmenting what should be a single channel’s performance data. It sounds trivial, but across hundreds of campaigns, it makes accurate channel reporting nearly impossible.
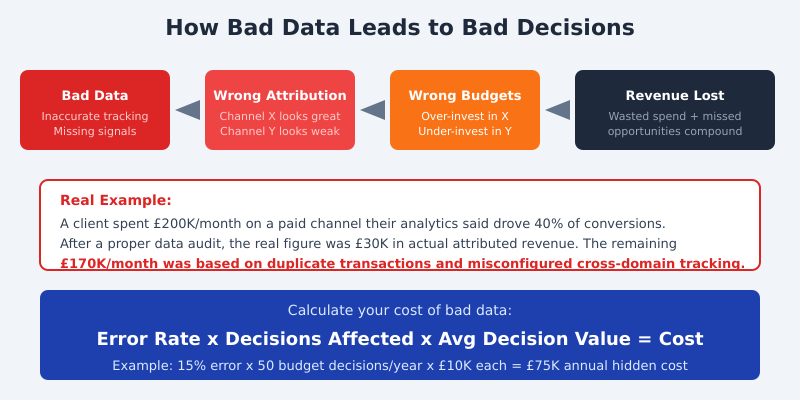
How Bad Data Leads to Bad Decisions
The chain reaction is predictable. Bad data produces wrong attribution. Wrong attribution drives wrong budget allocation. Wrong budget allocation wastes money on underperforming channels while starving the ones that actually work.
Here’s a real example from my consulting work. A mid-market e-commerce client was spending £200,000 per month on a paid media channel. Their analytics dashboard showed it driving 40% of all conversions. The CMO considered it their most important channel.
When we ran a proper data audit, cross-referencing analytics data with backend order records, the picture changed dramatically. Duplicate transaction fires were inflating the numbers by 3x. Cross-domain tracking breaks meant organic and direct traffic conversions were being misattributed to paid. The channel’s actual attributed revenue was closer to £30,000 per month — not £200,000.
That’s £170,000 per month in misallocated spend. Over a year, £2 million in budget decisions based on flawed data. And during those months, the brand’s genuinely high-performing email and organic search channels were being starved of investment.
Quantifying Your Data Quality Problem
You can’t fix what you can’t measure — and that applies to data quality itself. Here’s a straightforward formula I use with clients to estimate the cost of their data quality gaps:
Estimated Error Rate x Decisions Affected x Average Decision Value = Cost of Bad Data
Let’s work through a practical example. Say your analytics data has a 15% error rate (conservative for most mid-market businesses I audit). You make roughly 50 budget-related decisions per year based on that data. Each decision involves an average of £10,000 in spend. That gives you:
15% x 50 decisions x £10,000 = £75,000 in annual hidden costs
For larger enterprises, scale those numbers accordingly. A Harvard Business Review analysis found that the typical Fortune 1000 company could increase revenue by over $2 billion annually simply by improving data usability by just 10%.
The first step is honestly assessing where you stand. Pull a sample of 100 transactions from your analytics platform and compare them against your backend records. If the discrepancy is above 5%, you have a problem worth investigating.
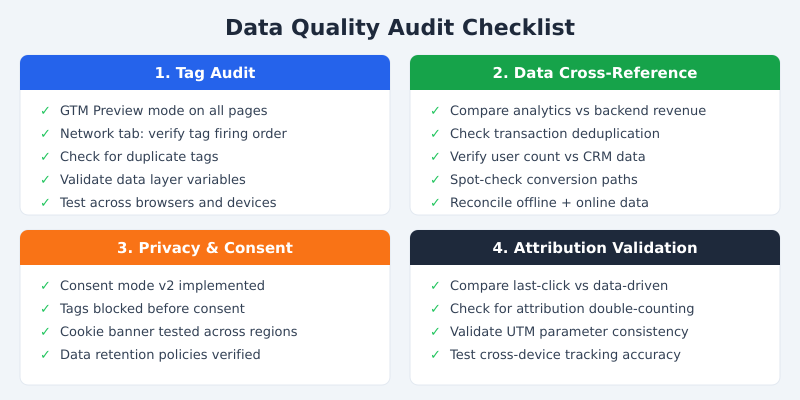
The Data Quality Audit: A Step-by-Step Guide
I run data quality audits for clients on a quarterly basis. Here’s the framework I’ve refined over hundreds of engagements. You can do this yourself with a small team and a few days of focused work.
Step 1: Tag Audit
Open Google Tag Manager’s Preview mode and walk through every key user journey on your site — homepage, product pages, checkout, confirmation. Check the browser’s Network tab simultaneously. You’re looking for tags that fire multiple times, tags that don’t fire at all, and tags that fire before consent is granted. Document every discrepancy.
Step 2: Cross-Reference Analytics with Backend Data
Export a week’s worth of transaction data from your analytics platform and from your actual order management system. Match them up. In my experience, the first time a company does this exercise, they find a 10-30% discrepancy. That gap is your data quality baseline — and likely the source of significant misallocation.
Step 3: Consent and Privacy Compliance Check
Test your cookie consent banner from multiple regions. Clear your cookies, visit your site, and verify that no analytics or marketing tags fire until you explicitly consent. Use a tool like the Cookiebot scanner to catch tags that slip through. This isn’t just a data quality issue — it’s a legal one that can carry fines of up to 4% of global revenue under GDPR.
Step 4: Attribution Model Validation
Run the same conversion data through multiple attribution models — last-click, first-click, and data-driven. If a single channel shows dramatically different results across models, that’s a red flag. It often indicates tracking gaps rather than genuine attribution differences. Pay particular attention to channels that look disproportionately strong in last-click but weak in other models.
Prevention Is Cheaper Than Cure
The most cost-effective approach to data quality is preventing errors before they enter your systems. Here’s what that looks like in practice.
Build a Data Governance Framework
Assign clear ownership for every data source. Someone should be accountable for the accuracy of your web analytics data, your CRM data, your advertising platform data, and the connections between them. At Deliveroo, we established a “data quality owner” for each major tracking domain. When something broke, there was no ambiguity about who needed to fix it.
Set Up Automated Monitoring and Alerts
Don’t wait for quarterly audits to catch problems. Configure automated alerts for anomalies: sudden drops in transaction volume, unexpected spikes in a traffic source, conversion rates that jump or fall by more than 20% day-over-day. Tools like Google Analytics anomaly detection and custom BigQuery monitoring scripts can catch most issues within hours rather than weeks.
Establish a Regular Audit Schedule
Quarterly is the minimum. Monthly is better for high-traffic sites. Every audit should include the four steps above: tag verification, backend cross-referencing, consent compliance, and attribution validation. The cost of running these audits is a fraction of the cost of the errors they prevent.
I also recommend implementing a standardised UTM naming convention with a shared reference document and validation rules. A simple Google Analytics campaign URL builder template with dropdown fields eliminates most naming chaos within weeks.
Frequently Asked Questions
How much does bad data actually cost a typical business?
Research from Gartner suggests an average of $12.9 million annually for large organisations. For mid-market businesses, the figure typically ranges from £50,000 to £500,000 per year in misallocated spend and missed opportunities — depending on how many budget decisions rely on analytics data.
What is the easiest way to check if my analytics data is accurate?
Export one week of transaction data from your analytics platform and compare it to your backend order system. Match order IDs and revenue figures. A discrepancy above 5% indicates a tracking issue worth investigating. This simple exercise takes a few hours and reveals most major data quality problems.
How often should I audit my analytics setup?
Quarterly at a minimum, monthly for high-traffic e-commerce sites. You should also run an audit after any significant website change — new checkout flow, CMS migration, consent banner update, or tag manager container changes. These events frequently break existing tracking without anyone noticing.
Can consent mode and GDPR compliance cause data loss?
Yes. A misconfigured consent banner can block analytics tags entirely, causing 40-60% data loss in regions with high consent-rejection rates. Google’s Consent Mode v2 mitigates this by modelling conversions for non-consenting users, but only if implemented correctly alongside your consent management platform.
What should I do first if I suspect my data is unreliable?
Start with the backend cross-reference test described above — compare analytics transactions to actual orders. Then run GTM Preview mode through your key conversion funnels. These two steps take less than a day and identify the majority of tracking issues. From there, prioritise fixes by revenue impact.
Stop the Leak
The cost of bad data isn’t an abstract number. It’s sitting in your marketing budget right now — in channels that look productive but aren’t, in optimisation opportunities you can’t see, and in board reports that paint a rosier picture than reality.
The good news is that data quality problems are fixable, and the return on fixing them is immediate. Every client I’ve worked with has found at least one significant budget misallocation within the first week of a proper data audit. Most find several.
Start with the backend cross-reference test. If your analytics revenue doesn’t match your actual revenue within 5%, you have a problem. And now you have a framework to find it, quantify it, and fix it before it costs you another quarter of leaked revenue.
If you’d like help running a data quality audit for your business, get in touch. I’ve helped organisations from FTSE 100 banks to Series B startups plug their measurement gaps — and the ROI typically pays for the engagement within the first month.