
Every SaaS dashboard I’ve ever reviewed starts the same way: MRR at the top, churn rate underneath, maybe a line chart showing both over time. These are the metrics that board decks are built around, that investors ask about first, and that founders check before breakfast. But here’s the problem — MRR and churn are lagging indicators. They tell you what already happened, not what’s about to happen next.
During my time as Head of Analytics at Deliveroo, I watched a SaaS-adjacent subscription business obsess over monthly revenue figures while ignoring the behavioural signals that actually predicted growth. Since moving into consulting, I’ve worked with dozens of SaaS companies — from seed-stage startups to Series C scale-ups — and the pattern repeats everywhere. The teams that grow fastest are the ones tracking the saas metrics that matter: the leading indicators that tell you where your business will be in 90 days.

This article breaks down the metrics that actually predict SaaS growth, with practical frameworks you can implement this week. No vanity metrics, no theoretical nonsense — just the numbers that move the needle.
The Problem with MRR and Churn as North Stars
Let me be clear: MRR and churn rate are important. You need them. But treating them as your primary operating metrics is like driving a car by only looking in the rear-view mirror.
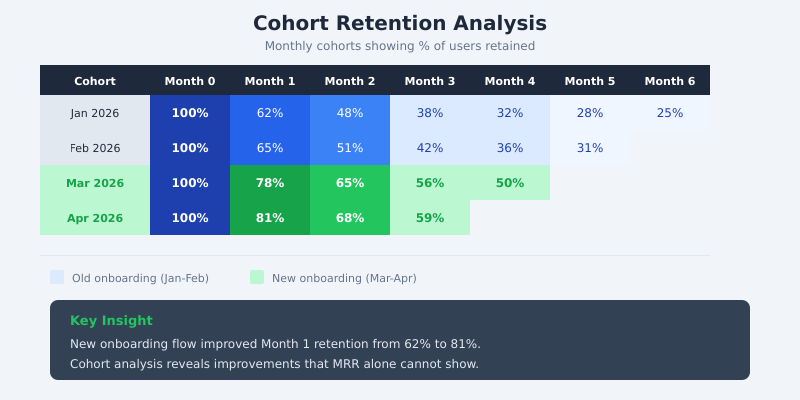
MRR is a lagging indicator. By the time your MRR growth slows, the root causes — poor activation, weak onboarding, lack of feature adoption — have been building for months. The same applies to churn. A customer who cancels in March probably started disengaging in December. Your aggregate churn number hides this entirely.
There’s also the nuance problem. A 5% monthly churn rate could mean very different things depending on whether it’s voluntary churn (customers actively cancelling) or involuntary churn (failed payments, expired cards). Similarly, MRR growth of 8% could be driven by new customer acquisition, expansion revenue from existing customers, or a mix of both. These distinctions matter enormously for deciding where to invest your resources.
As Bessemer Venture Partners’ State of the Cloud report consistently shows, the highest-performing SaaS companies differentiate themselves not by tracking different output metrics, but by obsessing over the input metrics that drive those outputs.

Activation Rate — The Most Underrated SaaS Metric
Activation rate measures the percentage of new signups who reach a defined “activated” state — meaning they’ve experienced enough value to likely stick around. This is not the same as completing signup or logging in once. Activation means a user has hit their aha moment: the point where they understand and experience the product’s core value.
For Slack, the aha moment is famously when a team sends 2,000 messages. For Dropbox, it’s saving the first file. For a project management tool, it might be creating a second project and inviting a teammate. The specific action varies, but the principle is universal: you need to define what “activated” means for your product, then measure how many users get there.
Finding your activation moment requires working backwards from retained users. Using tools like Mixpanel or Amplitude, you compare the behaviours of users who retained at 30 or 60 days against those who churned. The actions that show the largest difference in retention probability are your activation candidates.
In my consulting work, I’ve found that most SaaS companies have activation rates between 20% and 40%. The best I’ve seen hit 65-70%. Even a 10-percentage-point improvement in activation rate can transform your entire funnel — because activated users convert to paid at 3-5x the rate of non-activated users.

Time to Value (TTV)
Time to value measures how quickly a new user gets their first meaningful win with your product. It’s closely related to activation rate — but while activation measures whether users get there, TTV measures how fast.
Speed matters because every day between signup and first value is a day the user might abandon your product. Attention is finite. If your competitor delivers value in two hours and you deliver it in two weeks, you’ll lose — even if your product is technically superior.
One SaaS client I worked with last year had a TTV of 14 days. Their product required importing data, configuring integrations, and setting up custom dashboards before users saw any insights. We redesigned the onboarding to provide pre-built templates and sample data, letting users see the product’s value within the first session. TTV dropped to 3 days. Activation rate doubled within two months.
To reduce TTV, audit every step between signup and first value. Ask: “Can we remove this step? Can we automate it? Can we defer it until after the user has experienced value?” The answers almost always point to simplification. As the ProductLed framework puts it: reduce friction before the first value moment, add complexity after.
Revenue Expansion Rate
Net revenue retention (NRR) — sometimes called net dollar retention — is arguably the single most important metric for SaaS companies past product-market fit. It measures the revenue retained from existing customers over a given period, including expansion (upgrades, cross-sells, additional seats) and contraction (downgrades, churn).
An NRR of 100% means you’re replacing every pound lost to churn with expansion revenue. Above 100% means your existing customer base is growing on its own — even without any new customers. The best SaaS companies consistently achieve NRR above 120%, meaning their existing customers generate 20% more revenue each year.
According to Bessemer’s benchmarks, public SaaS companies with NRR above 120% trade at significantly higher revenue multiples than those below 100%. This makes sense: high NRR means your growth compounds. You can grow revenue even if your sales team has a bad quarter, because your existing customers keep expanding.
Tracking NRR also forces you to decompose your revenue into its components: new MRR, expansion MRR, contraction MRR, and churned MRR. This decomposition reveals the real story. I’ve seen companies celebrate 10% MRR growth while ignoring that 60% of it came from a single enterprise deal — and their expansion rate from existing customers was actually negative.
Customer Health Score
A customer health score is a composite metric that combines multiple usage signals into a single number representing how likely a customer is to renew, expand, or churn. Think of it as a leading indicator for your lagging retention metrics.
Building an effective health score requires identifying the behaviours that correlate with retention. In practice, I’ve found that four to six signals work best. Too few and the score is unreliable. Too many and it becomes a black box nobody trusts.
A practical health score framework includes:
- Login frequency — How often do users actually log in? Declining frequency is an early warning sign.
- Feature breadth — How many core features is the account using? Accounts using only one feature are fragile.
- Usage depth — Within the features they use, how deeply are they engaged? Surface-level usage suggests low switching cost.
- Support sentiment — Are support tickets increasing? Are CSAT scores declining?
- Contract signals — Time remaining on contract, billing issues, decision-maker changes.
Weight each signal based on its correlation with actual churn data. Platforms like Gainsight and Totango can automate this, but you can start with a simple spreadsheet model. The goal is to flag at-risk accounts 60-90 days before they would otherwise churn — giving your customer success team time to intervene.
Product-Qualified Leads (PQLs)
If you run a product-led growth (PLG) motion — free trials, freemium, or self-serve onboarding — then product-qualified leads should replace marketing-qualified leads as your primary pipeline metric.
A PQL is a user or account that has demonstrated, through product behaviour, a high likelihood of converting to paid. Unlike MQLs, which are based on marketing engagement (downloading a whitepaper, attending a webinar), PQLs are based on actual product usage. They’ve experienced value and are showing buying signals.
Common PQL signals include:
- Hitting usage limits on a free plan
- Inviting additional team members
- Using advanced features only available in paid tiers
- Returning to the product daily for a sustained period
- Visiting the pricing page multiple times
The advantage of PQLs over MQLs is conversion rate. In my experience across multiple SaaS clients, PQLs convert to paid at 25-35%, compared to 5-10% for traditional MQLs. OpenView’s PLG benchmarks show similar patterns across the industry. By focusing sales effort on product-qualified leads, you dramatically improve sales efficiency.
Building Your Metrics Framework
You don’t need to track all of these metrics from day one. The right framework depends on your stage and your biggest current constraint.
Pre-product-market fit: Focus on activation rate and time to value. Nothing else matters if users aren’t experiencing your core value proposition. Track these alongside qualitative feedback from your earliest users.
Post-product-market fit, pre-scale: Add NRR, customer health score, and PQLs. These metrics help you understand how well your product retains and expands within your existing customer base. This is where most SaaS companies should be investing their analytics effort.
At scale: Layer in segment-level analysis, cohort comparisons, and predictive models. At this stage, you’re optimising the machine — and the metrics framework from Sequoia’s data-informed product building guide provides an excellent structure for organising input and output metrics across your entire funnel.
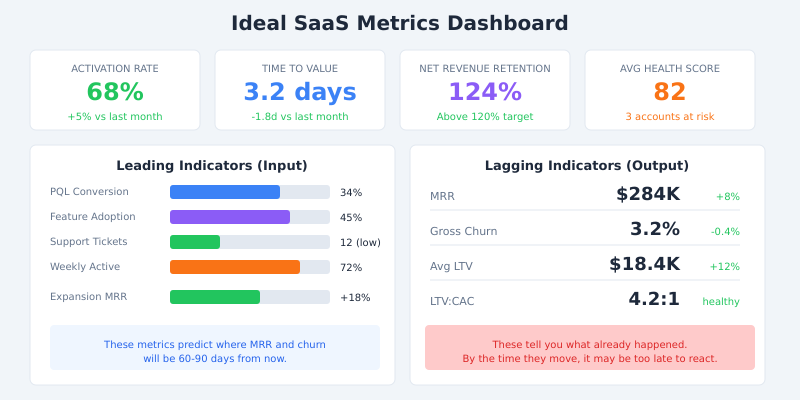
The most important principle is distinguishing input metrics (things you can directly influence) from output metrics (results of your inputs). MRR and churn are outputs. Activation rate, TTV, feature adoption, and health scores are inputs. Build your weekly operating reviews around inputs, and report outputs to the board monthly or quarterly.
Frequently Asked Questions
What is the most important SaaS metric beyond MRR?
Net revenue retention (NRR) is the strongest predictor of long-term SaaS growth. It captures both your ability to retain customers and expand revenue within your existing base. Companies with NRR above 120% consistently outperform on valuation and growth trajectory, because their revenue compounds without requiring proportional increases in customer acquisition spend.
How do you calculate activation rate for a SaaS product?
Activation rate equals the number of users who complete your defined activation event divided by total signups, expressed as a percentage. The key is defining the right activation event — typically the action most strongly correlated with 30-day retention. Use product analytics tools like Mixpanel or Amplitude to identify this by comparing behaviours of retained versus churned users.
What is a good net revenue retention rate?
For B2B SaaS, an NRR above 100% is healthy, above 110% is good, and above 120% is excellent. Enterprise-focused SaaS companies often achieve 130%+ because larger accounts tend to expand usage over time. SMB-focused products typically see lower NRR (90-110%) due to higher churn rates in that segment.
How do you build a customer health score?
Start by identifying 4-6 usage signals that correlate with retention: login frequency, feature breadth, usage depth, support sentiment, and contract signals. Weight each based on its predictive strength using historical churn data. Score each account on a 0-100 scale and set thresholds for “healthy” (above 70), “at risk” (40-70), and “critical” (below 40). Review and recalibrate quarterly.
What is the difference between MQLs and PQLs?
Marketing-qualified leads (MQLs) are identified through marketing engagement — downloading content, attending events, filling in forms. Product-qualified leads (PQLs) are identified through actual product usage — hitting free plan limits, using advanced features, inviting team members. PQLs typically convert at 3-5x the rate of MQLs because they’ve already experienced the product’s value firsthand.
Moving Beyond the Rear-View Mirror
The SaaS metrics that matter aren’t the ones that look impressive in a board deck. They’re the ones that give you enough warning to act before problems become crises, and enough clarity to double down on what’s actually working.
Start with activation rate and time to value — these two metrics alone will tell you more about your product’s health than MRR ever could. Add NRR to understand your expansion engine. Layer in health scores and PQLs as your team matures. And always remember: the goal isn’t to track more metrics. It’s to track the right ones and actually act on what they tell you.
If you’re building a SaaS product and want help identifying the metrics that will drive your specific growth stage, get in touch. I’ve helped SaaS teams from pre-seed to Series C build analytics frameworks that actually inform decisions — not just decorate dashboards.