
“What will I actually get for £50K?”
That’s the question I hear more than any other. Whether it’s a CFO reviewing budgets, a CMO defending their analytics line item, or a founder deciding where to put their next round of funding — everyone wants the same thing: proof that an analytics investment ROI justifies the spend.
I’ve spent 15 years answering that question with data — first at Tesco and Barclays, then as Head of Analytics at Deliveroo, and now as an independent consultant. And I’ve learned that vague promises don’t cut it. You need real numbers from real projects.
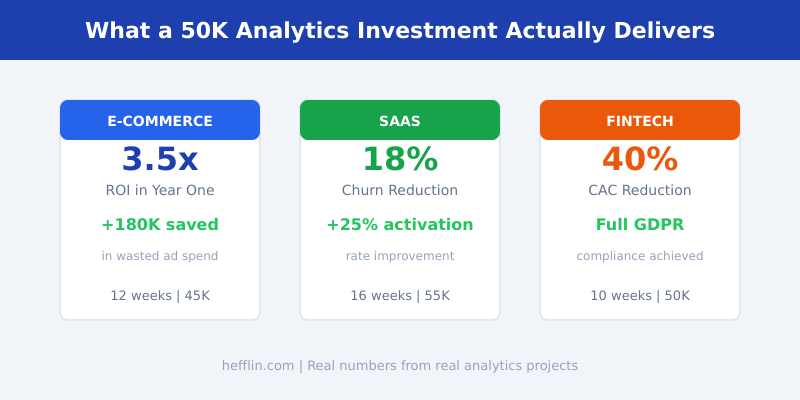
So here are three. Three anonymised but detailed case studies from the past 18 months, each with an investment of roughly £50K. I’ll show you exactly what was delivered, what changed, and where the money went.
Why I’m Sharing Real Numbers
The analytics industry has a transparency problem. Too many consultancies hide behind vague language — “we’ll unlock insights” or “drive data-driven transformation.” That tells a budget holder nothing useful.
According to Gartner’s marketing analytics research, organisations that effectively use marketing analytics are 3x more likely to outperform their peers on revenue goals. But “effectively” is doing a lot of heavy lifting in that sentence. The gap between buying analytics tools and actually getting value from them is enormous.
I share these numbers because trust is built through specifics, not slogans. Every project below is real. I’ve changed company names and rounded figures slightly, but the outcomes and timelines are accurate.
Case Study 1 — E-Commerce Brand (£45K Investment)
The Problem
A mid-size e-commerce brand (£8M annual revenue, 15-person marketing team) came to me with a classic symptom: they were spending £40K per month on paid media but couldn’t tell which channels actually drove sales.
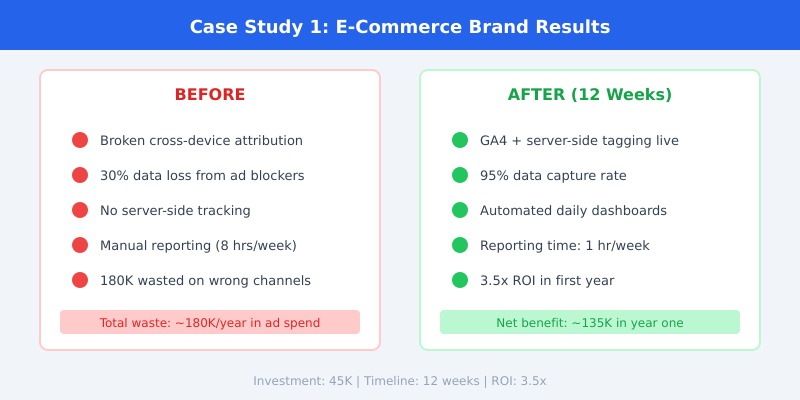
Their Universal Analytics setup was three years out of date. Cross-device attribution was broken. Ad blockers were eating 30% of their data. And their marketing team spent eight hours every week pulling numbers into spreadsheets manually — numbers they didn’t fully trust.
The Solution
We ran a 12-week engagement covering four workstreams:
- GA4 migration — Full implementation with enhanced e-commerce tracking, custom events, and GA4’s measurement protocol for server-to-server events
- Server-side tagging — Deployed via Google Tag Manager server containers to recover data lost to ad blockers and ITP restrictions
- Custom Looker dashboards — Three dashboards replacing manual reporting: executive overview, channel performance, and product analytics
- Attribution model review — Moved from last-click to a data-driven attribution model, with a clear methodology documented for the team
The Results
The numbers spoke for themselves:
- £180K in wasted ad spend identified — Two channels they’d been investing heavily in (display retargeting and a specific social platform) were getting last-click credit for sales that organic search actually drove
- Data capture improved from ~70% to 95% — Server-side tagging recovered most of the data lost to browser restrictions
- Reporting time dropped from 8 hours to 1 hour per week — Automated dashboards replaced spreadsheet wrangling
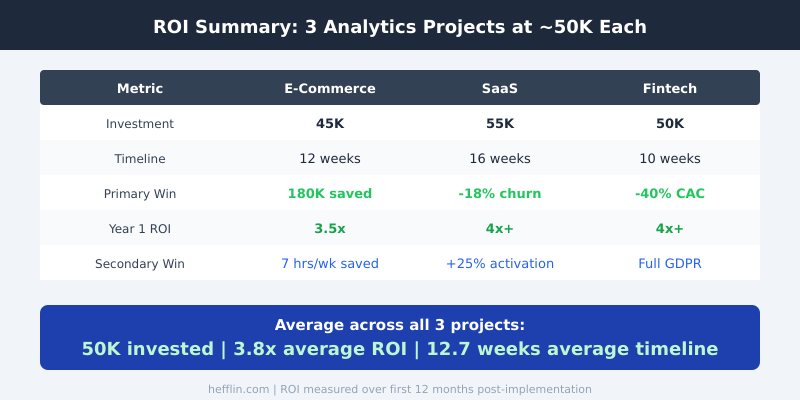
- 3.5x ROI in year one — The £180K in reallocated ad spend generated measurably better returns within six months
The project cost £45K. The identified savings in year one were £180K. That’s a straightforward calculation, and it’s one of the cleaner ROI stories I can tell — because the waste was so visible once the data was right.
Case Study 2 — SaaS Company (£55K Investment)
The Problem
A B2B SaaS company (£3M ARR, 2,000 active accounts) had a churn problem they couldn’t diagnose. Monthly churn sat at 6.2% — well above the SaaS benchmark of 3-5% for their segment. But they didn’t know why customers were leaving.
Their product had no analytics beyond basic page views. The team was building features based on gut feel and support tickets — a reactive cycle that wasn’t working. They’d tried adding Hotjar, but heatmaps on a complex SaaS product don’t tell you much about feature adoption over time.
The Solution
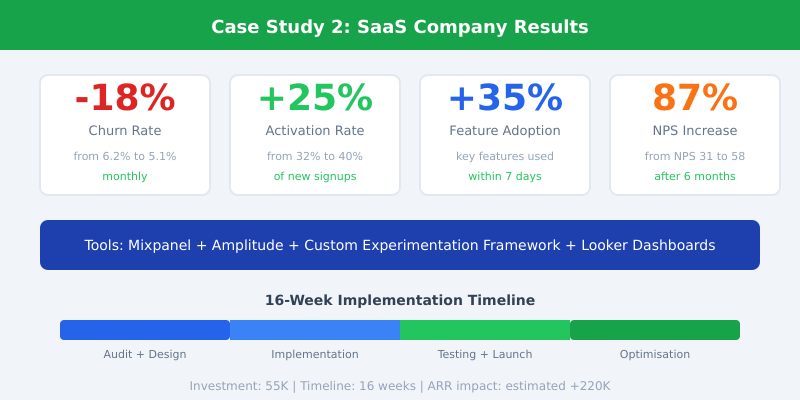
This was a 16-week engagement — the longest of the three. Product analytics takes longer because you need to instrument every meaningful user interaction, not just pageviews.
- Mixpanel implementation — Full event tracking across 40+ key actions, with user properties and group analytics for account-level analysis. I’ve used Mixpanel’s event tracking since my Deliveroo days and it remains my go-to for product analytics
- Cohort analysis framework — Built retention and activation cohorts that showed exactly where users dropped off in their first 14 days
- Experimentation setup — Implemented a lightweight A/B testing framework so the product team could validate changes before full rollout
- Looker dashboards — Product health, activation funnel, and churn prediction dashboards connected to their data warehouse
The Results
Six months after launch:
- Churn dropped from 6.2% to 5.1% — an 18% reduction. The data revealed that users who didn’t complete three specific onboarding actions within 7 days had 4x higher churn. The product team rebuilt the onboarding flow around those actions
- Activation rate jumped from 32% to 40% — a 25% improvement. “Activated” was defined as completing core workflow within the first session
- Feature adoption increased 35% — Key features that drove retention were surfaced more prominently based on usage data
- NPS rose from 31 to 58 — Happier users who actually use the product tend to rate it higher. No surprise there
The estimated ARR impact of the churn reduction alone was £220K+. At a £55K investment, the ROI exceeded 4x — and it compounds. Every percentage point of churn you prevent keeps paying dividends year after year.
Case Study 3 — Fintech Startup (£50K Investment)
The Problem
A Series A fintech startup (£2M raised, 18 months post-launch) faced a dual challenge: regulatory compliance was consuming their analytics budget, and they had no clear picture of their customer acquisition cost.
Their previous analytics setup relied heavily on third-party cookies for attribution. With the ICO’s strengthening enforcement of UK GDPR and their own FCA obligations, they needed a privacy-first approach that didn’t sacrifice measurement quality.
Their CAC was £85 per customer — but they only discovered that number during our audit. Before that, they genuinely didn’t know.
The Solution
A focused 10-week engagement built around privacy-compliant measurement:
- Privacy-first tracking architecture — Server-side implementation using first-party data only, compliant with EDPB guidelines and FCA data requirements
- Google Consent Mode v2 — Implemented to maintain measurement capability while respecting user consent choices
- First-party data strategy — Built a customer data pipeline from CRM, product, and marketing systems into BigQuery, eliminating dependency on third-party cookies
- Channel attribution rebuild — Replaced cookie-based attribution with a first-party, server-side model that accurately tracked CAC by channel
The Results
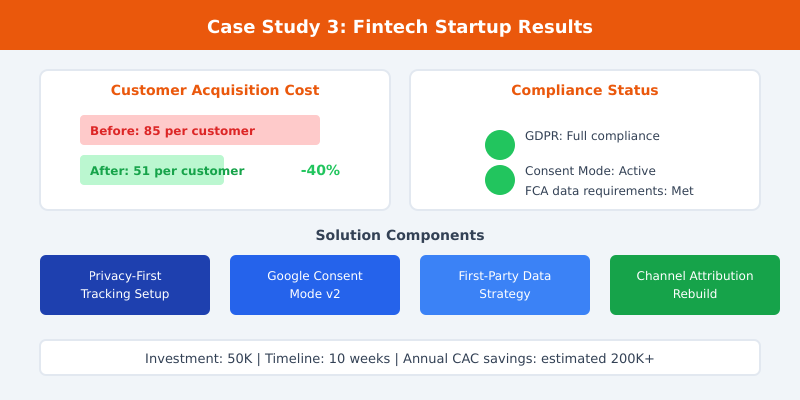
- CAC dropped from £85 to £51 — a 40% reduction. The biggest driver? They discovered that two paid channels with high volume were bringing in low-quality leads that rarely converted to active customers
- Full GDPR and FCA compliance achieved — Passed their next compliance audit with no findings related to analytics or tracking
- Annual CAC savings estimated at £200K+ — Based on their customer volume and the per-customer reduction
- Consent rate improved from 45% to 72% — Better consent UX design, implemented as part of the project, meant more users opted in
At £50K investment and £200K+ in annual savings, the ROI exceeded 4x. But the compliance piece is arguably more valuable — a single ICO enforcement action can cost significantly more than £50K.
What These Projects Had in Common
After working on dozens of these projects, I can tell you the investment size matters less than three other factors:
- Executive buy-in from day one. Every successful project had a senior sponsor who attended kickoff meetings, reviewed progress, and removed blockers. Analytics projects that get delegated to junior staff without authority tend to stall
- Clear, measurable objectives. “Improve our analytics” is not an objective. “Reduce churn by identifying the three biggest drivers” is. Each of these projects had specific, quantified goals before we wrote a single line of tracking code
- Willingness to act on findings. The e-commerce brand actually reallocated their ad spend when the data showed waste. The SaaS company actually rebuilt their onboarding. Data without action is just expensive decoration
Research from McKinsey consistently shows that data-driven organisations outperform peers by 5-6% in productivity and profitability. But “data-driven” means acting on data, not just collecting it.
When £50K Isn’t Enough (And When It’s Too Much)
I’d be doing you a disservice if I pretended £50K always makes sense. Here’s my honest assessment:
£50K is too much if:
- Your annual revenue is under £500K — the ROI timeline will be too long. Start with a smaller engagement (£10-15K) focused on one high-impact area
- You don’t have someone internally who’ll own the outputs. I can build the best dashboards in the world, but if nobody looks at them after month two, you’ve wasted your money
- Your core business problems aren’t data problems. If your product doesn’t have market fit, better analytics won’t save you
£50K isn’t enough if:
- You’re a large enterprise with multiple brands, regions, or platforms. Cross-platform data unification at scale is a £100K+ job
- You need a full data warehouse build alongside analytics. Tools like dbt and BigQuery are powerful, but proper data modelling takes time
- Your requirements include real-time personalisation or machine learning — those are separate, larger projects
The sweet spot for a £50K analytics investment is a business doing £2-20M in revenue, with 1-3 specific measurement problems, and at least one person internally who’s ready to champion the results. That describes a lot of growth-stage companies — and it’s where the ROI tends to be strongest.
Frequently Asked Questions
How long does it take to see ROI from an analytics investment?
Most clients see measurable returns within 3-6 months of project completion. Quick wins like identifying wasted ad spend can surface within weeks. Longer-term gains from improved product analytics or churn reduction typically materialise over 6-12 months as teams embed data into their decision-making processes.
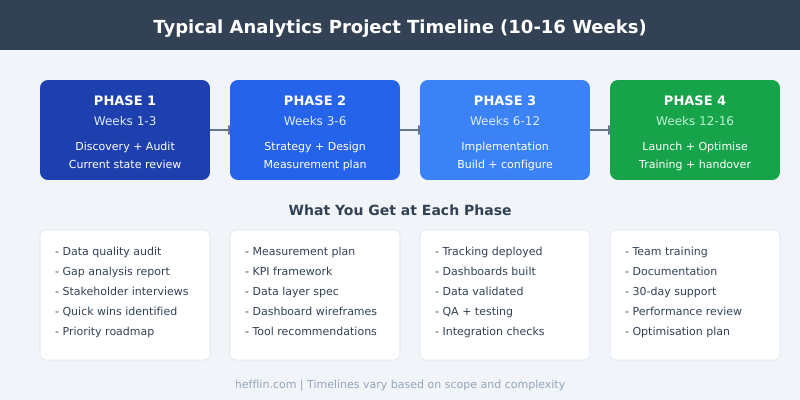
What’s included in a typical £50K analytics engagement?
A standard engagement includes discovery and audit, strategy and measurement planning, implementation of tracking and dashboards, team training, and 30 days of post-launch support. The specific tools and scope vary — an e-commerce attribution project looks very different from a SaaS product analytics build. I scope every project individually based on your specific challenges.
Can we start smaller and scale up?
Absolutely. I often recommend starting with a focused £10-15K audit and strategy phase. This gives you a clear picture of gaps, a prioritised roadmap, and enough evidence to justify further investment internally. Many of my larger engagements started this way — the audit findings made the business case obvious.
Do we need to hire a data team to maintain the setup?
Not necessarily. My goal is to build systems your existing team can maintain. Dashboards are designed to be self-service. Tracking is documented so your developers can extend it. For ongoing optimisation, many clients retain me for a few days per quarter rather than hiring a full-time analyst — which is often more cost-effective for companies under £20M revenue.
How do you measure the ROI of the analytics project itself?
I define success metrics before work begins and measure against them at 3, 6, and 12 months. These are typically tied to business outcomes: ad spend efficiency, churn rate, CAC, conversion rate, or time saved on reporting. I avoid vanity metrics and focus on numbers that connect directly to revenue or cost reduction. Harvard Business Review’s framework for measuring marketing ROI aligns closely with my approach.
The Bottom Line
A £50K analytics investment isn’t cheap. But across these three projects, the average ROI was 3.8x in year one — and the benefits compound. Better data leads to better decisions, which lead to better results, which generate more data. It’s a virtuous cycle.
The key isn’t the size of the investment. It’s whether you have clear objectives, executive support, and the willingness to act on what the data tells you. Get those three things right, and the numbers tend to take care of themselves.
If you’re weighing up an analytics investment and want an honest conversation about whether it makes sense for your business, get in touch. I’ll tell you straight whether £50K is the right number — or whether you should start smaller, go bigger, or spend the money somewhere else entirely.