
Over the past 15 years, I’ve helped build analytics capabilities at more than 50 companies. Retail giants, fintechs, fast-growth startups, government bodies. The ones that succeed all share one thing: culture eats dashboards for breakfast. You can spend millions on the fanciest tools and hire the sharpest data scientists. None of it matters if the people making decisions don’t use the data sitting in front of them.
That’s the hard truth I’ve learned across stints at Tesco, Barclays, Deliveroo, and dozens of consulting engagements. Building a data culture isn’t a technology problem. It’s a people problem. And it’s one you can solve — if you’re willing to be patient and strategic about it.
What Data Culture Actually Means
Let me be blunt: data culture is not dashboards. It’s not tools. It’s not hiring a team of data scientists and hoping for the best. I’ve seen all three approaches fail spectacularly.
Data culture is the collective habit of using evidence to make decisions — at every level of an organisation, from the boardroom to the front line. It’s what happens when a marketing manager instinctively asks “what does the data say?” before approving a campaign, or when a product team kills a beloved feature because the numbers don’t support it.
Tom Davenport nailed it back in 2007 with Competing on Analytics: the companies that win are the ones that embed analytical thinking into their operating model. Nearly two decades later, McKinsey’s research on data-driven enterprises confirms that fewer than 25% of organisations have actually achieved this. The gap between aspiration and reality remains enormous.
The reason? Most companies treat data culture as a project with a finish line. It isn’t. It’s a practice — like fitness. You don’t “finish” getting fit. You build habits, maintain them, and adapt as circumstances change.
The 4 Pillars of Data Culture
After working across dozens of organisations, I’ve found that genuine data culture rests on four pillars. Miss any one of them and the whole thing wobbles.
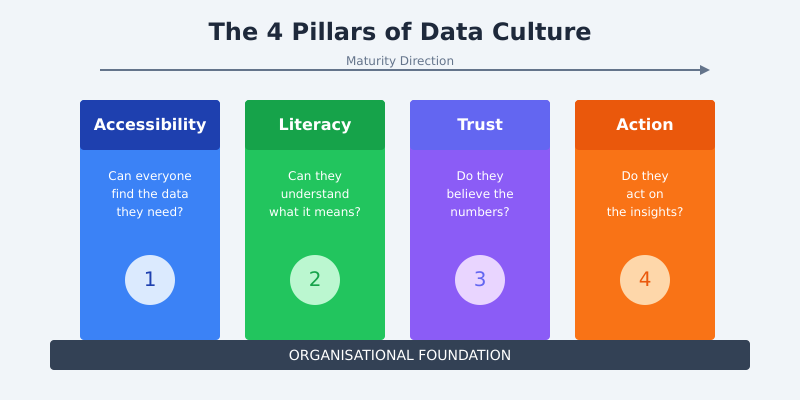
1. Accessibility
Can everyone find the data they need? In most organisations, the answer is no. Data lives in silos — the finance team has their spreadsheets, marketing has their analytics platform, and product has their event tracking. Nobody has the full picture. At Deliveroo, one of my first priorities was creating a single source of truth that every team could access. It took months, but it transformed how quickly people could answer their own questions.
2. Literacy
Can they understand it? Access without comprehension is useless. I’ve seen executives stare at beautifully designed dashboards and draw completely wrong conclusions because they didn’t understand statistical significance or survivorship bias. Tableau’s data culture framework rightly emphasises that literacy training isn’t optional — it’s foundational.
3. Trust
Do they believe the numbers? This is the silent killer. If people don’t trust the data, they’ll find reasons to ignore it. Trust gets destroyed by inconsistent metrics, unexplained discrepancies between reports, and that one time the dashboard showed wrong numbers during a board meeting. Trust takes years to build and seconds to lose.
4. Action
Do they act on it? This is where most organisations fall down. They have the data, they understand it, they even trust it — but the decision-making process doesn’t change. Decisions still get made by the highest-paid person’s opinion (HiPPO), and the data serves as post-hoc rationalisation rather than genuine input.
Lessons That Surprised Me
Fifteen years of doing this work has taught me things I never expected. Here are the four lessons that shaped my approach most.
Lesson 1: Start with the Sceptics, Not the Enthusiasts
This is counterintuitive. When you’re building a data culture, your instinct is to work with the people who are already on board. Don’t. They’ll adopt data practices regardless.
At Barclays, I spent three months working closely with a VP who was openly sceptical about our analytics programme. He believed his 20 years of experience told him more than any dashboard could. Rather than arguing, I asked him what his three biggest uncertainties were. We built a simple weekly report addressing just those questions. Within six weeks, he was the one asking for more data. His conversion had more organisational impact than training 50 willing analysts, because his peers watched and followed.
Lesson 2: Self-Serve Is a Myth Without Training
At Tesco, we invested heavily in Tableau licences across the business. The idea was simple: give people the tools and they’ll find the answers themselves. Usage dropped 40% within three months.
Why? Because handing someone a powerful tool without teaching them how to use it is like giving someone a piano and expecting a concerto. Gartner’s research on self-service analytics consistently shows that successful self-serve programmes require at least 40 hours of training per user in the first year. We learned this the hard way and built a structured training programme that turned things around.
Lesson 3: The Best Dashboard Is the One Nobody Needs
This sounds paradoxical, but hear me out. If your team needs to check a dashboard before every decision, something is wrong. The goal is to embed data thinking so deeply that the key metrics live in people’s heads. Dashboards should be for exploration and edge cases, not for checking whether yesterday was a good day.
At Deliveroo, we eventually moved to automated alerts that only surfaced when something unexpected happened. This freed the team from dashboard-watching and focused their analytical energy on genuine problems.
Lesson 4: Data Culture Is Top-Down, Not Bottom-Up
I used to believe data culture was a grassroots movement. I was wrong. If leadership doesn’t actively ask for data — not just approve its collection — culture change stalls. MIT Sloan’s research on data culture found that executive sponsorship is the single strongest predictor of success. When the CEO asks “what’s the data behind this recommendation?” in every meeting, behaviour changes fast.
The Anti-Patterns: What Kills Data Culture
I’ve seen these four patterns kill data culture more often than any technology failure. Recognise them early, because they’re expensive to fix once they take root.
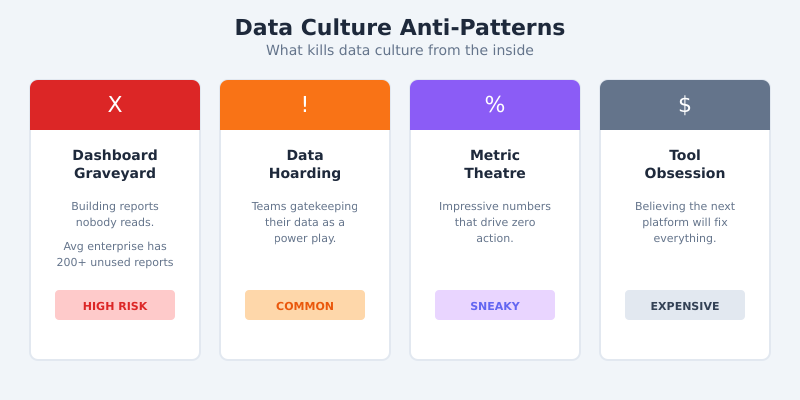
The Dashboard Graveyard
Every enterprise I’ve worked with has at least 200 reports that nobody looks at. They were built for a meeting that happened once, a stakeholder who left, or a question nobody asks anymore. The cost isn’t just the storage — it’s the maintenance burden and the confusion when new joiners try to figure out which report is “the right one.” Regular audits are essential. If nobody has opened a report in 90 days, archive it.
Data Hoarding
Some teams treat their data like a power base. They gatekeep access, insist on being the middlemen for every request, and resist standardisation because it would mean sharing their advantage. This is organisational cancer. I once worked with a retail client where the marketing team and the commercial team had two completely different customer counts — and each refused to reconcile with the other. It took executive intervention to resolve.
Metric Theatre
This is the practice of presenting impressive-looking numbers that drive no actual decisions. Vanity metrics, cherry-picked timeframes, year-on-year comparisons that ignore seasonal effects. Harvard Business Review’s analysis of performance measurement traps describes this perfectly. If a metric doesn’t change behaviour, it’s theatre.
Tool Obsession
The belief that the next platform will fix everything. I’ve watched companies cycle through three or four analytics platforms in five years, spending millions each time, because they mistook a culture problem for a technology one. The tool is never the bottleneck. The habits are.
A 90-Day Data Culture Playbook
If you’re starting from scratch — or restarting after a failed attempt — here’s the playbook I’ve refined across dozens of engagements. It won’t transform your organisation in 90 days, but it will create genuine momentum.
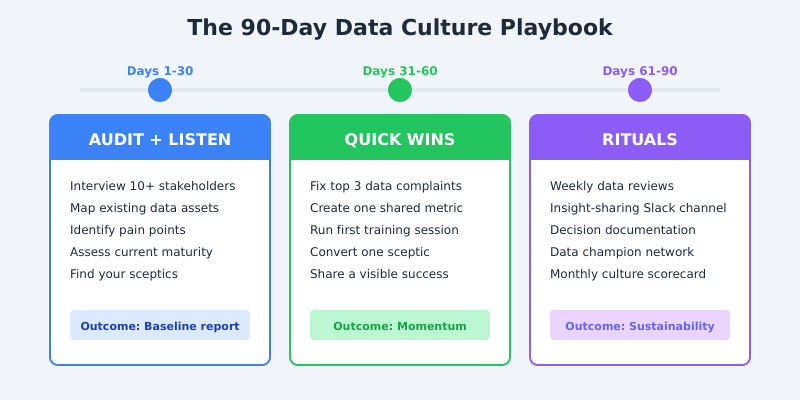
Days 1-30: Audit and Listen
Don’t change anything yet. Interview at least 10 stakeholders across different functions. Ask three questions: What data do you use today? What data do you wish you had? What frustrates you about the current setup? Map existing data assets and identify the biggest pain points. This phase gives you the baseline you’ll measure progress against.
Days 31-60: Quick Wins
Pick the three things people complained about most and fix them. It might be a broken report, a metric that nobody agrees on, or a dataset that’s impossible to access. These wins build credibility and show sceptics that change is happening. During this phase, run your first training session and find your first converted sceptic. Share every win visibly — Slack, email, town halls.
Days 61-90: Install Rituals
Sustainable culture change requires rituals. Install a weekly data review where teams share one insight and one action they took based on data. Create an insight-sharing channel. Start documenting decisions and the data behind them. Identify data champions in each team — not analysts, but business people who’ve embraced data thinking. ThoughtSpot’s research on data-driven cultures shows that companies with formal data champion programmes see 3x higher adoption rates.
Beyond 90 Days
Scale what works, kill what doesn’t. Not every ritual will stick. Not every champion will stay engaged. That’s fine. The goal is to make data thinking so normal that it stops being remarkable. You’ll know you’ve succeeded when people stop talking about “being data-driven” because it’s just how things work.
Measuring Culture Change
You can’t manage what you can’t measure — and yes, that applies to culture too. Here are the metrics I track with clients:
- Data request volume: Are ad-hoc requests to the data team increasing or decreasing? Initially they’ll rise (awareness), then fall (self-serve kicks in).
- Self-serve ratio: What percentage of data questions get answered without involving an analyst? Target 60-70% within 12 months.
- Decision documentation: How many decisions reference specific data points? Track this in meeting minutes or decision logs.
- Employee survey scores: Add “I trust the data available to me” and “I regularly use data in my decision-making” to your engagement survey. Track the trend quarterly.
- Dashboard engagement: Not just logins, but time spent and actions taken after viewing. Forrester’s data-driven insights framework provides a solid model for measuring this.
Be patient with these metrics. Cultural shifts take 12-18 months to show up in numbers. The leading indicators are qualitative: are more people asking questions? Are meetings getting shorter because people came prepared with data? Are teams resolving disagreements with evidence rather than authority?
Frequently Asked Questions
How long does it take to build a data culture?
Expect 18-24 months for meaningful change and 3-5 years for it to become self-sustaining. You can create early momentum within 90 days using the playbook above, but lasting cultural shifts require patience and consistent leadership commitment. Quick wins build credibility, but rituals and habits take much longer to embed across an organisation.
Do you need a large budget to build a data culture?
No. The biggest investments are time and leadership attention, not technology. Many of the most effective culture-building activities — stakeholder interviews, training sessions, weekly data reviews, insight-sharing channels — cost almost nothing. I’ve seen well-funded programmes fail and shoestring efforts succeed. Budget helps with tooling, but culture is free.
What’s the biggest mistake companies make when trying to become data-driven?
Treating it as a technology problem. Companies buy expensive platforms expecting behaviour to change automatically. It doesn’t. The tools only work if people know how to use them, trust the outputs, and have the authority to act on insights. Start with people and processes, then select tools that support the habits you’re building.
Should every employee learn SQL or Python?
No. Data literacy doesn’t mean everyone writes code. It means everyone can read a chart correctly, understand basic statistics, ask good questions, and interpret results with appropriate scepticism. Technical skills should be concentrated in your data team. Business users need analytical thinking skills, not programming skills.
How do you measure the ROI of data culture initiatives?
Track the speed and quality of decisions. Measure time-to-insight (how long from question to answer), decision reversal rates (fewer reversals mean better initial decisions), and project success rates. NewVantage Partners’ annual survey consistently shows data-driven companies outperform peers by 5-6% in productivity and profitability.
Start Small, Stay Consistent
Data culture isn’t a project with a deadline. It’s a practice you build, maintain, and evolve. After 50+ engagements, the pattern is clear: the organisations that succeed aren’t the ones with the biggest budgets or the flashiest tools. They’re the ones where leadership genuinely values evidence, where people feel safe asking questions, and where data thinking becomes invisible because it’s everywhere.
Start with the audit. Listen to your sceptics. Fix the things that frustrate people. Install rituals. Be patient. And above all, lead by example — because if you’re not asking for data in your own decisions, nobody else will either.
If you’re working on building a data culture and want an outside perspective, get in touch. I’ve been through this process enough times to know what works, what doesn’t, and where the hidden pitfalls are.