
Every analytics conversation I’m brought into starts the same way. A leader shows me a wall of dashboards and asks, “Why aren’t we getting more out of this?” The honest answer is rarely about the tools. It’s about analytics maturity — how far an organisation has actually travelled from gut-feel decisions to data being woven into how the business thinks.
After 15 years doing this work — first as a Senior Analyst at Tesco and Barclays, then as Head of Analytics at Deliveroo, and now as an independent consultant — I’ve seen that you can’t skip stages. You can buy your way to more dashboards, but you can’t buy your way to a culture that trusts and uses them. Maturity is earned in order.
This guide gives business leaders a practical map: the five stages of the analytics maturity model, how to recognise where you sit today, and what it takes to move up one level — not three at once.
What an Analytics Maturity Model Actually Is
An analytics maturity model is a staged framework that describes how an organisation’s use of data evolves over time. Each stage builds on the one below it. The point isn’t to label yourself and feel good or bad about it — it’s to diagnose the single constraint holding you back, so your next investment goes where it’ll actually move the needle.
The idea has been around for years in various forms. A common framing describes a climb from descriptive analytics (“what happened”) through diagnostic, predictive and prescriptive analytics (“what should we do”). I use a simpler, leadership-friendly version with five stages, because boards don’t make decisions about “diagnostic capability” — they make decisions about people, budgets and rituals.
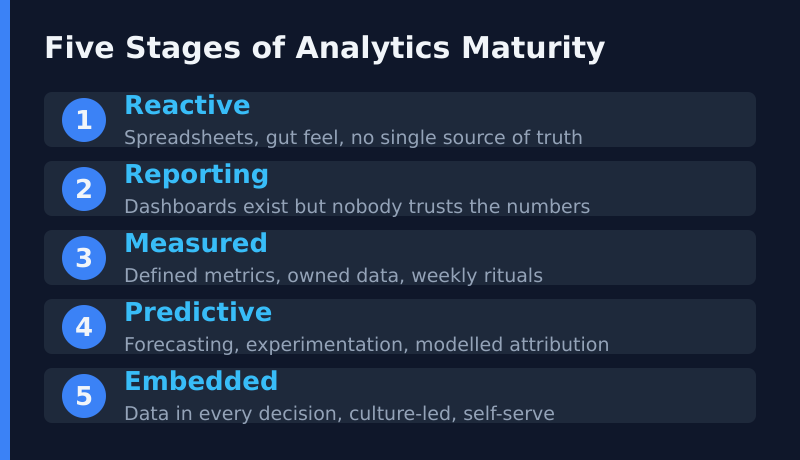
Stage 1: Reactive
At the reactive stage, data exists but it’s scattered. Numbers live in spreadsheets, each team keeps its own version, and there’s no agreed source of truth. Decisions are made on instinct, and analytics shows up only when something has already gone wrong.
You’ll recognise this stage by the arguments. Two people present “the revenue number” and the figures don’t match, so the meeting derails into whose spreadsheet is right. I’ve watched senior teams lose an hour to that exact debate. The fix isn’t a fancier tool — it’s agreeing on definitions and one place to look.
What moves you up: Pick a single trusted reporting tool, define your core metrics in plain language, and ban competing spreadsheets from leadership meetings.
Stage 2: Reporting
Now you have dashboards. Lots of them. The reporting stage feels like progress — there’s a screen for everything — but the dashboards describe the past without changing the future. Worse, people still don’t fully trust the numbers, so they quietly fall back on their own spreadsheets anyway.
This is the most common stage I encounter, and it’s a trap. Adding more dashboards here doesn’t help; it spreads attention thinner. The bottleneck is trust, not coverage. If your team double-checks the dashboard before they believe it, you’re stuck at stage two no matter how polished the charts look.
What moves you up: Audit your tracking so the data is demonstrably correct, then ruthlessly cut dashboards down to the few that drive decisions. I wrote more about how broken measurement quietly drains money in The True Cost of Bad Data.
Stage 3: Measured
At the measured stage, the numbers are trusted, owned and acted on. Each key metric has a named owner. There’s a regular rhythm — a weekly or monthly ritual where leaders look at the same trusted view and ask sharp questions. Data starts informing decisions before problems become crises.
When I was at Deliveroo, our executive team gathered every Monday around one screen for 30 minutes. That single ritual once helped us spot a checkout problem worth millions before it ever reached a board report. That’s the measured stage in action — not more data, but a disciplined habit of using it.
- Core metrics have named, accountable owners
- There’s a standing decision ritual on a fixed cadence
- People act on the numbers instead of re-deriving them
What moves you up: Start building forward-looking capability — forecasts, experiments and proper attribution — rather than only explaining the past.
Stage 4: Predictive
The predictive stage is where analytics stops being a rear-view mirror. You forecast demand, model which channels actually drive value, and run structured experiments instead of arguing about opinions. Decisions get tested before they’re scaled.
This is the first stage that genuinely requires specialist skill and clean foundations. You cannot forecast reliably on data you don’t trust — which is exactly why skipping stages fails. A predictive model built on stage-two data just produces confident nonsense.
What moves you up: Make sure these capabilities are repeatable and self-serve, not locked in one clever analyst’s head.
Stage 5: Embedded
At the embedded stage, data isn’t a department — it’s a default. Teams reach for evidence instinctively, can answer their own questions without waiting on a central queue, and the culture treats “what does the data say?” as a normal opening question, not a special request.
Very few organisations live here, and that’s fine. The goal isn’t to reach stage five as fast as possible. It’s to honestly know where you stand and make the one investment that earns your next stage. Building this kind of instinct is really a question of culture, which I explored in Building a Data Culture.
How to Diagnose Your Stage Honestly
Most leaders overrate where they sit. The dashboards make stage two feel like stage four. Here’s a simple, uncomfortable test: ask three people in different teams for the same headline number. If you get three answers, you’re at stage one. If you get one answer but nobody can tell you who owns it or how it’s defined, you’re at stage two.
You can buy your way to more dashboards. You can’t buy your way to a team that trusts them.
Run the test before you spend a penny on new tooling. The stage you’re actually at tells you what to fix. A reactive organisation needs agreement, not algorithms. A reporting organisation needs trust and pruning. Only a measured organisation is ready to invest in prediction.
Frequently Asked Questions
Can we skip stages if we hire enough talent?
No. Talent accelerates each climb, but it can’t substitute for the foundations. A brilliant data scientist working on untrusted data produces untrusted predictions. Build the floor before you build the tower.
How long does it take to move up a stage?
In my experience, six to twelve months per stage for a committed mid-sized organisation. The reporting-to-measured jump is usually the hardest, because it’s about behaviour and trust rather than technology.
Which stage should most companies aim for?
Stage three, measured, is the realistic target for most businesses and delivers the bulk of the value. Predictive and embedded are worthwhile only once the measured habit is genuinely solid.
Key Takeaways
Analytics maturity is a ladder you climb in order, not a switch you flip with a bigger budget. Diagnose your real stage with the three-people test, fix the one constraint that’s actually holding you back, and resist the urge to leap ahead. Most of the value lives in simply reaching the measured stage — trusted numbers, clear owners, and a disciplined habit of using them.
If you’re not sure where your organisation sits, start with the test above. Where you are tells you exactly what to do next.