Fintech customer acquisition costs have risen roughly 60% since 2020. I’ve watched this trend accelerate from both sides of the table — first as a Senior Analyst at Barclays, where I worked with the digital banking and fintech partnership teams, and now as a consultant helping challenger banks and payment platforms make sense of their growth spend.
The uncomfortable truth? Most fintechs are burning money on acquisition channels they can’t properly measure. During my time at Barclays, we discovered that 40% of our PPC spend was generating sign-ups that never completed onboarding. That single finding redirected over £2 million in annual budget toward channels that actually delivered activated customers.
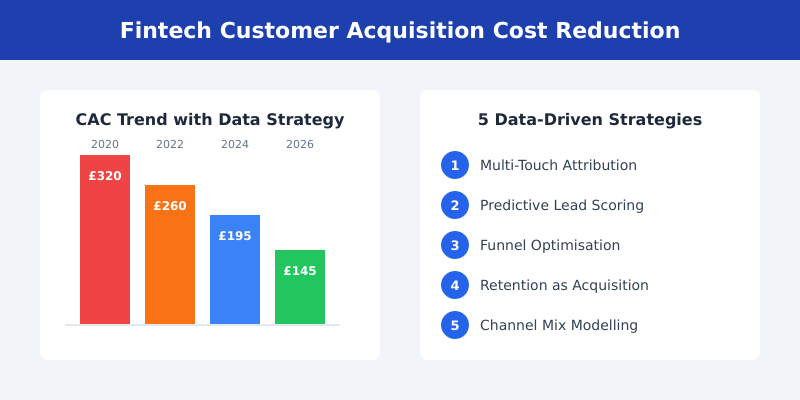
This article breaks down five data-driven strategies that fintech companies use to reduce customer acquisition costs — strategies I’ve seen deliver 30-50% CAC reductions when properly implemented. Whether you’re running a neobank, a lending platform, or a payments startup, these approaches work because they focus on measuring what matters, not just what’s easy to track.
Why Fintech CAC Is Out of Control
Three forces are pushing fintech acquisition costs to unsustainable levels.
Rising competition for the same audience. According to CB Insights’ State of Fintech report, over 26,000 fintech companies now compete globally. That’s 26,000 companies bidding on the same Google keywords, targeting the same Facebook audiences, and sponsoring the same podcasts. The result is predictable: paid media costs have doubled in most financial services categories.
Regulation adds friction (and cost). Unlike a SaaS product where someone can sign up and start using the tool in minutes, fintech onboarding involves KYC (Know Your Customer) checks, identity verification, and compliance approvals. Each step in that process is a drop-off point. The FCA’s regulatory requirements mean UK fintechs face particularly steep compliance-driven acquisition costs.
The trust gap is expensive to close. People are cautious about where they put their money. Research from Edelman’s Trust Barometer shows that financial services consistently ranks among the least trusted industries. Overcoming that scepticism requires more touchpoints, more content, and more social proof — all of which cost money.
Industry benchmarks tell the story clearly. The average fintech CAC now sits between £150 and £350 depending on the product category, according to data from Plaid’s fintech industry resources. Neobanks pay the most. Payment apps sit in the middle. Lending platforms vary wildly depending on loan type and geography.
But here’s what I’ve learned from working with over a dozen fintech clients: the companies with the lowest CAC aren’t spending less. They’re measuring better. Let me show you how.
Strategy 1 — Attribution Beyond Last Click
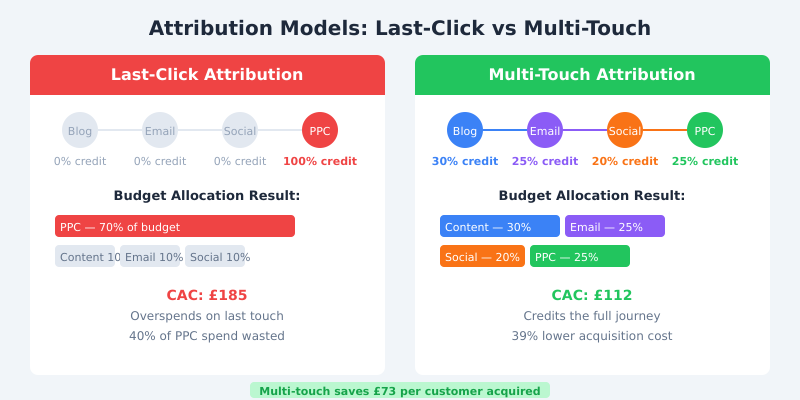
The biggest source of wasted fintech marketing spend is bad attribution. Most companies I audit still rely on last-click attribution, which means all the credit for a conversion goes to the final touchpoint before sign-up.
In fintech, this is particularly misleading. The typical customer journey involves 8-12 touchpoints over 2-6 weeks. Someone reads a comparison article, sees a social ad, gets retargeted, reads a trust pilot review, receives an email from a friend, and then clicks a branded PPC ad to sign up. Last-click gives 100% of the credit to that PPC ad.
At Barclays, switching to a data-driven multi-touch attribution model using Google Analytics 360 and BigQuery was a turning point. We built a model that weighted each touchpoint based on its statistical contribution to conversion, rather than its position in the journey.
The results were striking. Content marketing — which last-click had valued at just 3% of conversions — was actually initiating 28% of eventual sign-ups. Meanwhile, generic PPC keywords that looked like top performers under last-click were generating sign-ups with 60% lower lifetime value than organic and referral channels.
How to implement this: Start with a Google Analytics 4 data-driven attribution model if you don’t have the resources for a custom build. It’s not perfect, but it’s dramatically better than last-click. For larger teams, build a custom model in BigQuery using Shapley values — the statistical method that fairly distributes credit across all touchpoints.
Strategy 2 — Predictive Lead Scoring
Not all sign-ups are created equal. One of the most effective ways to reduce CAC is to stop treating every lead the same and instead focus your spending on prospects most likely to convert and stay.
Predictive lead scoring uses behavioural data to rank prospects by their likelihood of becoming activated, profitable customers. In fintech, this goes beyond simple demographics. The strongest signals I’ve found come from product engagement patterns during the research phase.
Working with a UK challenger bank last year, we built a scoring model using Mixpanel’s behavioural analytics that identified three key predictors of high-quality sign-ups:
- Pricing page visits of 90+ seconds — users who actually read the fee structure converted at 3x the average rate and had 40% lower churn
- Feature comparison tool usage — prospects who compared plans were 2.5x more likely to complete KYC
- Help centre visits before sign-up — counter-intuitively, these users had the highest LTV because they were doing genuine due diligence
With this scoring model, we shifted paid media targeting to focus on audiences that matched high-scoring behavioural profiles. We also reduced retargeting spend on low-scoring visitors who were unlikely to complete onboarding. The net effect was a 28% reduction in effective CAC within three months.
The key insight: stop optimising for sign-ups and start optimising for activated customers. In fintech, a sign-up that never completes KYC isn’t a customer — it’s a cost.
Strategy 3 — Funnel Optimisation with Real Data
Fintech funnels are uniquely complex. Unlike e-commerce where the path is browse-cart-checkout, a fintech funnel typically runs: visit, sign-up, email verification, KYC document upload, identity verification, approval, first transaction. Each stage has mandatory compliance requirements that create friction.
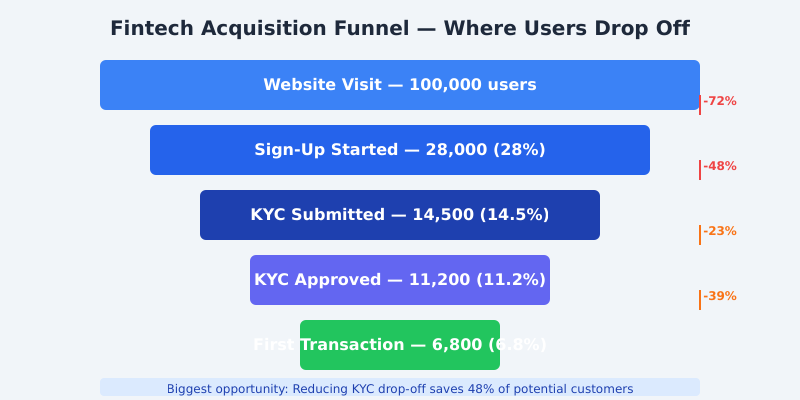
The data consistently shows that the biggest drop-off in fintech funnels happens at KYC submission — typically 40-55% of users who start sign-up never complete identity verification. This is where your real acquisition cost explodes, because you’ve already paid to acquire a visitor who showed intent but got lost in compliance friction.
What actually works to fix this:
- Progressive profiling — collect information in stages rather than one long form. One client reduced KYC drop-off by 34% simply by splitting their verification flow into three shorter steps with progress indicators
- Document upload optimisation — mobile camera integration for ID verification reduced failed uploads by 60% compared to manual file selection
- Real-time status updates — sending SMS and email updates during the verification waiting period cut abandonment by 22%. Users weren’t dropping off because of the wait — they were dropping off because they didn’t know what was happening
- Error recovery flows — instead of a generic “verification failed” page, building specific recovery paths for each failure type (blurry photo, expired ID, address mismatch) recovered 18% of previously lost applicants
I use Amplitude’s funnel analysis capabilities for this kind of work because the segmentation is excellent — you can break down drop-off by device type, traffic source, and user cohort simultaneously. That granularity matters because mobile users and desktop users fail at different stages for different reasons.
Strategy 4 — Retention as Acquisition
Here’s a number that should change how every fintech thinks about growth: reducing churn by just 5% can increase profitability by 25-95%, according to research originally published by Harvard Business Review. In fintech, where switching costs are relatively low and competitors are one app store search away, retention isn’t just about keeping customers — it’s your most powerful acquisition channel.
Retained customers reduce your effective CAC in three ways:
- Higher LTV amortises acquisition cost. A customer who stays 36 months instead of 12 cuts your effective monthly CAC by two-thirds, even if you spent the same to acquire them
- Referrals from happy customers are your cheapest channel. The fintech referral data I’ve seen consistently shows referred customers have 37% higher retention and 16% higher LTV than paid-acquisition customers
- Product-led growth compounds. When users genuinely love your product, word-of-mouth, app store ratings, and social sharing create organic growth that costs nothing
The practical step is to build referral programme analytics that track the full chain: who referred whom, what channel they used, whether the referred user activated, and what their 90-day engagement looks like. Most fintechs measure referral programme sign-ups but don’t connect that data to downstream activation and retention.
One payment platform I work with restructured their referral incentive based on this analysis — switching from a flat £10 cash bonus to a tiered reward that paid out after the referred user completed their third transaction. Referral quality (measured by 90-day retention) improved by 45%, and the programme’s effective CAC dropped to £35 per activated customer.
Strategy 5 — Channel Mix Modelling
The final strategy ties everything together. Channel mix modelling (sometimes called media mix modelling or MMM) uses statistical analysis to determine the true contribution of each marketing channel to your overall acquisition numbers — accounting for factors that digital attribution misses.
Digital attribution tells you which clicks led to conversions. Channel mix modelling tells you what would happen to your total acquisition numbers if you shifted £50,000 from display advertising to content marketing. These are fundamentally different questions, and you need both answers.
For fintech specifically, channel mix modelling reveals insights that click-based attribution completely misses:
- Brand awareness has a delayed payoff. Podcast sponsorships and PR coverage don’t generate immediate clicks, but they increase branded search volume 4-6 weeks later — and branded search converts at 3-5x the rate of generic search
- Organic content is massively undervalued. Blog posts, comparison pages, and educational content often initiate journeys that finish through paid channels. Without MMM, you’ll over-credit paid and under-invest in content
- Some channels cannibalise others. I’ve seen fintechs where branded PPC was simply intercepting users who would have converted through organic search anyway — effectively paying for conversions they’d already earned
Google’s open-source Meridian marketing mix model is a solid starting point for teams with data science capability. For smaller teams, start simpler: run controlled geo-experiments where you turn off a channel in one region and measure the impact on total conversions, not just attributed conversions.
Putting It All Together: The CAC Reduction Framework
These five strategies don’t work in isolation. The fintechs I’ve seen achieve the biggest CAC reductions follow a phased approach that builds measurement foundations first, then optimises, then scales.
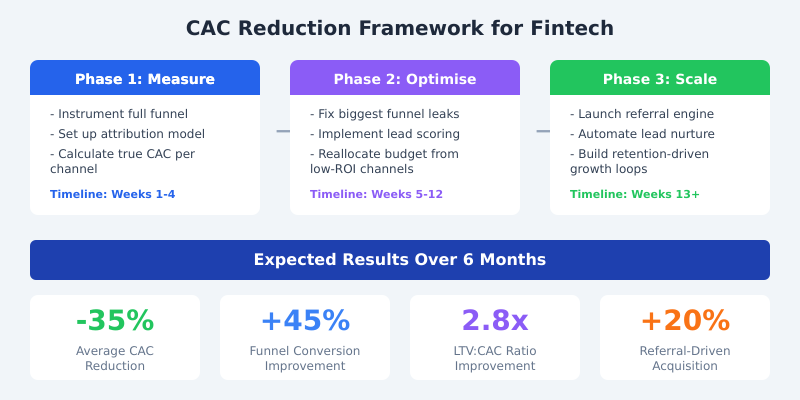
Phase 1 (Weeks 1-4): Measure. Instrument your full funnel from first touch to activated customer. Set up multi-touch attribution. Calculate your true CAC per channel — not cost per sign-up, but cost per activated customer.
Phase 2 (Weeks 5-12): Optimise. Fix the biggest funnel leaks (usually KYC drop-off). Implement lead scoring to focus spend on high-intent prospects. Reallocate budget away from channels with poor LTV:CAC ratios.
Phase 3 (Weeks 13+): Scale. Launch a data-informed referral programme. Build automated nurture sequences for different lead score tiers. Implement channel mix modelling to guide long-term budget allocation.
Based on my consulting work, fintechs that follow this framework consistently see 30-50% CAC reductions within six months. The measurement phase alone typically uncovers enough waste to fund the rest of the programme.
Frequently Asked Questions
What is a good customer acquisition cost for a fintech company?
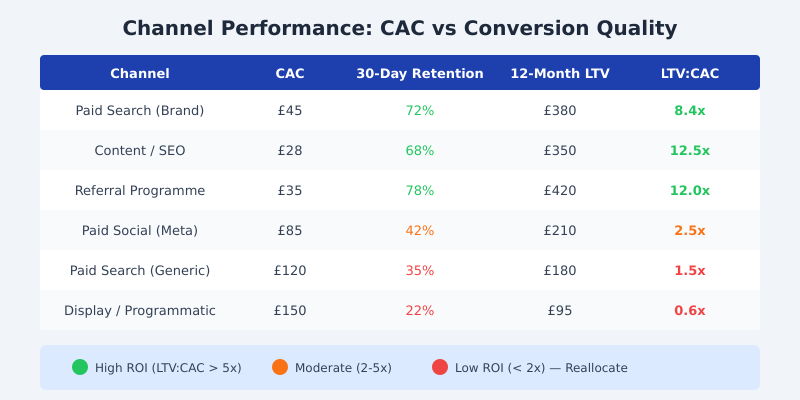
Good CAC varies significantly by fintech category. Neobanks typically see £150-£300, payment platforms £80-£180, and lending products £50-£250 depending on loan type. The more useful metric is LTV:CAC ratio — aim for at least 3:1 to ensure sustainable unit economics. A lower CAC with poor retention is worse than a higher CAC with strong lifetime value.
How long does it take to see results from CAC reduction strategies?
Quick wins from funnel optimisation and budget reallocation typically show results within 4-8 weeks. Attribution model improvements take 2-3 months to accumulate enough data for confident decisions. Full channel mix modelling and referral programme maturation require 6-12 months. Start with measurement — you can’t optimise what you don’t track accurately.
Does multi-touch attribution work for fintech with long sales cycles?
Yes, and it’s actually more important for fintech precisely because sales cycles are longer. When journeys span 2-6 weeks with 8-12 touchpoints, last-click attribution becomes increasingly misleading. Use data-driven attribution models that weight touchpoints by their statistical contribution to conversion, and ensure your attribution window covers your full typical journey length.
What analytics tools work best for fintech CAC tracking?
For attribution and funnel analysis, I recommend Mixpanel or Amplitude for product-level tracking, combined with GA4 for marketing attribution. BigQuery serves as an excellent data warehouse for combining marketing spend with product activation data. For channel mix modelling, Google’s open-source Meridian framework or Meta’s Robyn are strong starting points for teams with data science resources.
Should fintech companies prioritise reducing CAC or increasing LTV?
Both matter, but start with measurement. Many fintechs don’t know their true CAC because they measure cost per sign-up rather than cost per activated customer. Fix that first. Then focus on the biggest lever — usually funnel optimisation delivers the fastest CAC reduction, while retention improvements drive the largest LTV gains. The two strategies compound: lower CAC plus higher LTV dramatically improves unit economics.
The Bottom Line
The fintech companies winning the acquisition game in 2026 aren’t the ones spending the most — they’re the ones spending the smartest. Every strategy in this article comes back to one principle: measure the full picture, then act on what the data actually shows you.
Start by fixing your attribution model. You’ll almost certainly discover that your current channel mix is based on incomplete data. From there, layer in lead scoring, funnel optimisation, retention analytics, and channel mix modelling. Each strategy compounds the others.
Having spent 15 years in financial services analytics — from Barclays’ digital banking division to consulting with some of the UK’s fastest-growing fintech startups — I can tell you that the companies who invest in measurement infrastructure first consistently outperform those who jump straight to tactics. The data doesn’t just reduce your costs — it shows you exactly where your next customer is coming from.
If you’re a fintech leader looking to get your acquisition costs under control, I’d suggest starting with the measurement phase outlined above. Map your full funnel, implement proper attribution, and calculate your true cost per activated customer. That single exercise often reveals enough insight to pay for everything that follows.