
Every Monday morning at Deliveroo, our executive team gathered around one screen. Not to look at revenue (that number was already in everyone’s inbox). We gathered to ask five specific questions about the data behind the revenue. That single ritual, which took just 30 minutes, helped us spot a checkout abandonment problem that was costing us an estimated £2.3 million a year — before it showed up in the monthly board report.
Most e-commerce CEOs I work with today are drowning in dashboards. They have access to more data than ever, but they’re asking the wrong questions — or worse, not asking questions at all. They glance at top-line revenue, feel relieved or panicked, and move on. That approach leaves money on the table every single week.
After 15 years working with e-commerce brands — from my early days analysing Tesco’s online grocery operation to leading analytics at Deliveroo and now consulting with growing DTC brands — I’ve distilled the noise down to five ecommerce analytics questions that actually move the needle. Ask these every week, and you’ll make better decisions in a month than most leaders make in a quarter.
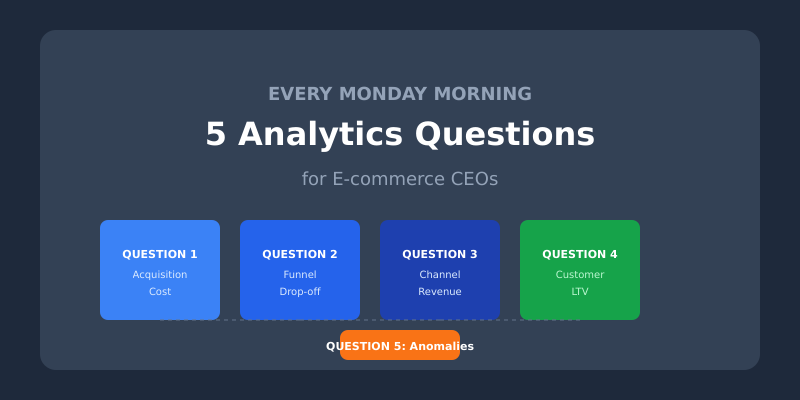
Question 1: “What’s Our Real Customer Acquisition Cost This Week?”
This sounds basic. It isn’t. Most e-commerce brands I audit are miscalculating their customer acquisition cost (CAC) in at least one significant way. They divide total ad spend by new customers and call it a day. That number is almost always wrong — and it’s usually too optimistic.
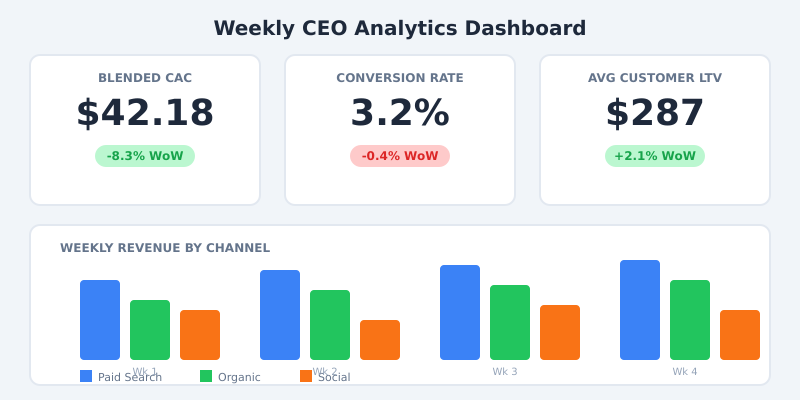
Your blended CAC should include every cost involved in acquiring a customer: paid media, agency fees, creative production, referral programme costs, and the portion of your marketing team’s salaries dedicated to acquisition. According to ProfitWell’s research on CAC benchmarks, most companies undercount acquisition costs by 30-50%.
But blended CAC alone isn’t enough. You need it broken down by channel. When I was at Deliveroo, we discovered that our Instagram acquisition cost was four times higher than Google Search — but the Instagram cohort had a 60% higher repeat order rate. The blended number hid a nuance that completely changed our budget allocation.
What to ask your team:
- What’s our blended CAC this week vs. the last four-week average?
- Which channel’s CAC moved the most, and why?
- Are we including all costs, or just media spend?
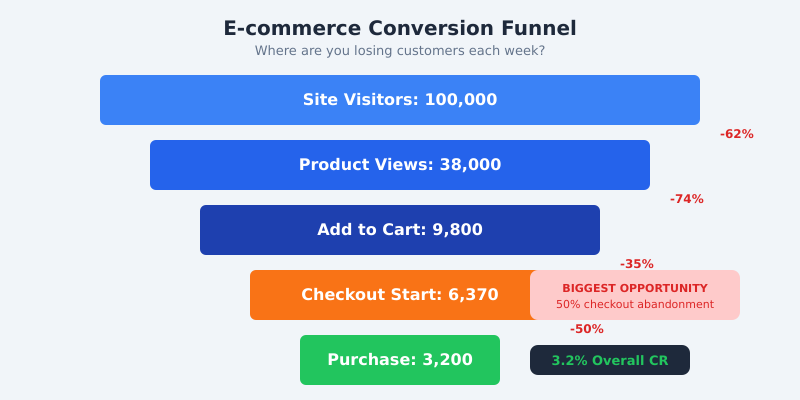
Question 2: “Where Are We Losing People in the Funnel?”
Revenue is the output. Your conversion funnel is the machine that produces it. If you only check the output, you’ll never know which part of the machine is breaking down until it’s too late.
Every week, you should know the conversion rate at each stage: homepage to product page, product page to add-to-cart, cart to checkout initiation, and checkout to purchase. According to the Baymard Institute’s cart abandonment research, the average online cart abandonment rate sits around 70%. But that average hides huge variation. Your job is to find your specific weak point.
During my time working with Tesco’s online grocery team, we found that a single step in the checkout — the delivery slot selection page — was causing a 23% drop-off. Customers weren’t abandoning because of price. They were abandoning because all the convenient slots were already taken, and the page didn’t communicate availability clearly. A UX change to that one page recovered an estimated £8 million in annual revenue.
What to ask your team:
- Which funnel step had the biggest change in conversion rate this week?
- Is the drop-off consistent across devices, or is it mobile-specific?
- Did we deploy any site changes that could explain the shift?
Tools like Hotjar and FullStory can help you see exactly where users struggle, adding qualitative context to the quantitative drop-off data.
Question 3: “Which Marketing Channels Actually Drove Revenue?”
This is where most e-commerce analytics fall apart. Your ad platforms will each claim credit for the same sale. Google says their ad drove it. Meta says their ad drove it. Your email platform says the newsletter drove it. The customer probably interacted with all three before buying.
Last-click attribution — which most platforms default to — massively over-credits the final touchpoint and under-credits everything that built awareness and intent. Google’s own research suggests that data-driven attribution in GA4 can reveal a very different picture of channel value compared to last-click models.
You don’t need a perfect attribution model. Perfect attribution doesn’t exist. What you need is a consistent one that you review weekly. I recommend tracking two numbers side by side: platform-reported revenue (what each channel claims) and your actual verified revenue from your e-commerce platform. The gap between those two numbers is your “attribution tax” — and it typically runs 20-40% for most brands.
What to ask your team:
- What’s our total platform-reported revenue vs. actual revenue this week?
- Which channel had the biggest gap between claimed and verified revenue?
- If we turned off our lowest-performing channel tomorrow, what would we actually lose?
For a deeper dive into getting attribution right, the team at Segment has an excellent guide on multi-touch attribution that’s worth reading.
Question 4: “What’s Our Customer Lifetime Value Trend?”
Single-purchase metrics tell you about today. Customer lifetime value (LTV) tells you about next quarter and next year. If your LTV is trending down, you have a retention problem that will eventually crush your margins — no matter how efficiently you acquire new customers.
The metric I care about most is the LTV:CAC ratio. A healthy e-commerce business should have an LTV:CAC ratio of at least 3:1, meaning each customer generates three times more revenue than it cost to acquire them. According to the U.S. Small Business Administration, businesses that track this ratio consistently grow 2-3x faster than those that don’t.
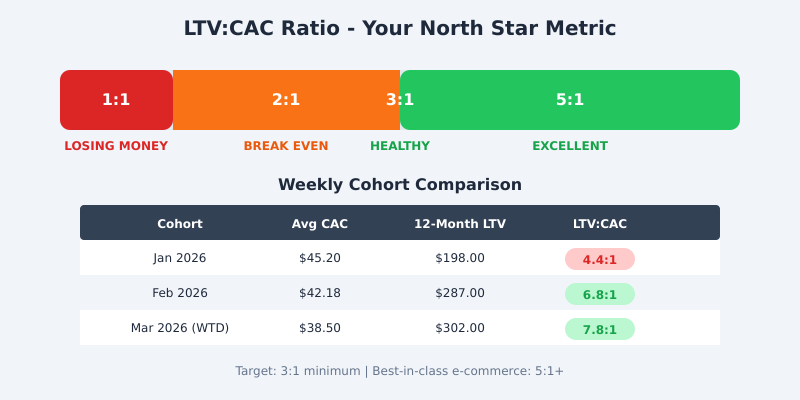
Track LTV by acquisition cohort, not as a single blended number. Customers acquired through organic search might have a very different LTV than those who came through a flash sale on Instagram. When I consult with DTC brands, the cohort view almost always reveals that 20-30% of marketing spend is going to channels that attract one-time bargain hunters rather than loyal repeat buyers.
What to ask your team:
- What’s our 90-day LTV for the cohort we acquired 90 days ago vs. the one before?
- What’s our current LTV:CAC ratio by channel?
- What’s our repeat purchase rate this week, and how does it compare to the trailing average?
Question 5: “What Changed This Week That We Didn’t Expect?”
This is the question that separates good analytics teams from great ones. The first four questions are about known metrics. This one is about the unknown unknowns — the anomalies, outliers, and surprises hiding in your data.
At Deliveroo, we built automated anomaly detection that flagged any metric deviating more than two standard deviations from its trailing average. One Friday, it flagged a 40% spike in customer support contacts from a specific postcode area. Turned out a local competitor had shut down, and we were absorbing their customers — but our local rider supply hadn’t scaled to match. Without that flag, we’d have delivered a terrible first experience to hundreds of potential long-term customers.
You don’t need sophisticated machine learning for this. Tools like Amplitude’s anomaly detection or even a simple spreadsheet with conditional formatting can highlight when something unusual happens. The key is building a culture where your team actively looks for surprises, not just confirmation.
What to ask your team:
- What’s the most unexpected thing in this week’s data?
- Did any metric move in the opposite direction of what we predicted?
- Are there any segments (geography, device, customer type) behaving differently from the rest?
How to Build Your Weekly Analytics Ritual
Knowing the right questions is only half the battle. You need a repeatable process that makes asking them effortless. Here’s the framework I set up for every e-commerce client I work with.
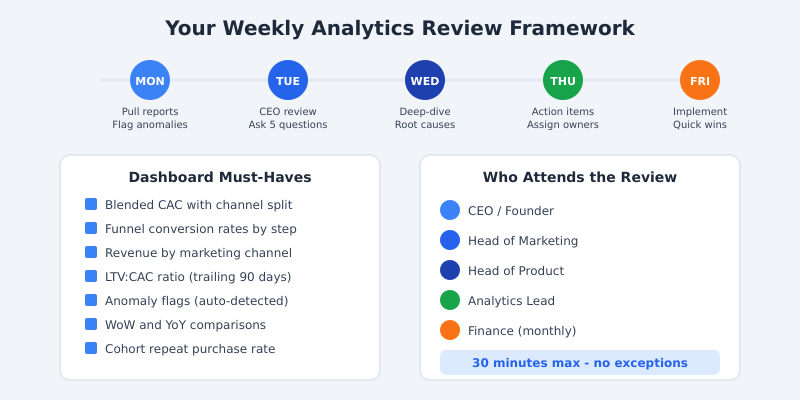
Monday: Your analytics team pulls the weekly report and flags anything unusual. This should be automated — if someone is manually building a dashboard every Monday, you’re wasting their talent.
Tuesday: The CEO and senior leadership review the dashboard together. Walk through the five questions. This meeting should take 30 minutes, maximum. If it takes longer, your dashboard needs simplifying.
Wednesday: The analytics team digs into any issues flagged on Tuesday. Root cause analysis, not surface-level explanations.
Thursday: Action items are assigned with clear owners and deadlines. Every insight should lead to a decision or an experiment.
Friday: Quick wins get implemented before the weekend. Bigger initiatives get added to the sprint backlog.
The dashboard itself should fit on one screen. If you need to scroll, you have too many metrics. I recommend Looker or Tableau for building these kinds of executive views, but even a well-structured Google Sheet works if that’s where your team is today.
The best analytics setup is the one your team actually uses. Don’t let perfect be the enemy of weekly.
Frequently Asked Questions
How long should a weekly analytics review take?
Keep it to 30 minutes. If your review takes longer, your dashboard is too complex or your team is presenting raw data instead of insights. The goal is decisions, not data tours. Prepare the dashboard before the meeting so the time is spent discussing, not waiting for reports to load.
What tools do I need for weekly e-commerce analytics?
At minimum, you need a web analytics platform (GA4 or similar), your e-commerce platform’s built-in reporting, and a dashboard tool to combine them. Most brands at the £1M-£50M revenue range do well with GA4, their Shopify or platform analytics, and Looker Studio. Larger operations benefit from a dedicated data warehouse like BigQuery or Snowflake.
What’s a good LTV:CAC ratio for e-commerce?
The widely accepted benchmark is 3:1 as a minimum healthy ratio. Best-in-class e-commerce brands typically achieve 5:1 or higher. Below 3:1, you’re likely spending too much on acquisition relative to the value each customer brings. Above 8:1 might actually mean you’re under-investing in growth.
Should I use last-click or multi-touch attribution?
Neither model is perfect, but multi-touch attribution gives a more realistic picture of how your channels work together. I recommend running both models side by side for at least three months to understand the differences. The gap between them reveals which channels are getting over- or under-credited in your current setup.
How do I get started if we have no analytics process today?
Start with just one question — pick whichever feels most urgent for your business. Build a simple report around it. Review it weekly for a month. Once that habit sticks, add a second question. Within three months, you’ll have all five running. Trying to implement everything at once usually leads to abandoning the process entirely.
Start Asking Better Questions This Week
The difference between e-commerce brands that scale and those that stall often comes down to this: the scaling brands ask better questions about their data, and they ask them consistently. These five ecommerce analytics questions aren’t complicated. They don’t require a data science team or expensive tooling. They require discipline and curiosity.
Pick one question from this list. Build a simple report around it. Review it next Monday. I’ve watched this approach transform decision-making at companies from Deliveroo to small DTC startups with five employees. The data is already there — you just need to start asking it the right things.
If you need help setting up your weekly analytics framework or want a fresh pair of eyes on your e-commerce data, get in touch. I’ve been helping brands build exactly this kind of data-driven culture for over 15 years, and I’d be happy to help you get started.