
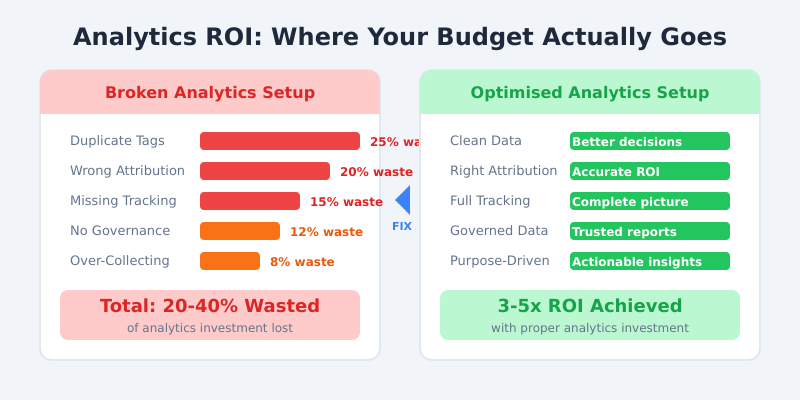
I’ve seen it more times than I can count. A marketing team spends six figures on their analytics stack, only to discover that 20-40% of that investment is wasted on broken tracking, duplicate tags, and data nobody trusts. When I was a Senior Analyst at Barclays, we uncovered that our analytics setup was double-counting conversions on three separate product pages. The fix took two days. The cost of the bad data we’d been using to make decisions? Roughly £180,000 in misallocated marketing spend over six months.
If your analytics setup is costing you money, you’re not alone. According to Harvard Business Review, poor data quality costs the US economy an estimated $3.1 trillion annually. For individual companies, the damage shows up as wasted ad spend, wrong business decisions, and missed revenue opportunities.
The good news? Most analytics problems follow predictable patterns. I’ve spent 15 years identifying and fixing them across enterprises like Deliveroo and Tesco, and for consulting clients ranging from Series A startups to FTSE 250 companies. This article walks you through the five most expensive mistakes, how to spot them, and a practical framework to fix them.
The 5 Most Expensive Analytics Mistakes
After auditing analytics setups for dozens of organisations, I’ve found these five mistakes account for the vast majority of wasted budget. Each one is surprisingly common, and each one is fixable.

1. Duplicate Tags Firing (15-25% Cost Inflation)
This is the silent budget killer. During my time as Head of Analytics at Deliveroo, we discovered that a site redesign had left two versions of our Google Analytics tag running simultaneously. Every pageview was counted twice. Every conversion was doubled. Our cost-per-acquisition numbers looked fantastic on paper, but we were paying Google for duplicate event hits and making decisions based on inflated data.
Duplicate tags typically happen when multiple teams deploy tracking independently, when legacy tags survive platform migrations, or when tag management isn’t centralised. Google Tag Manager’s best practices guide specifically warns against this, yet I see it on roughly 60% of the sites I audit.
The cost: Duplicate events inflate your GA4 or Adobe Analytics event volume, pushing you into higher pricing tiers. They also corrupt your data, which leads to bad decisions downstream.
2. Wrong Conversion Attribution (10-30% Budget Misallocation)
Attribution determines where your marketing budget goes. Get it wrong, and you’re pouring money into channels that aren’t performing while starving the ones that are. I worked with a B2B SaaS company that was attributing 70% of conversions to their branded search campaigns. After we fixed their attribution model, we discovered that their content marketing and LinkedIn campaigns were actually driving the initial awareness. They’d been over-investing in brand search by £40,000 per month.
The shift from Universal Analytics to GA4’s data-driven attribution has made this worse for many companies. Teams migrated without properly configuring their new attribution settings, and many are still running on last-click by default.
3. Missing Cross-Domain Tracking (20-50% Data Loss)
If your customer journey spans multiple domains (your marketing site, a payment provider, a booking system), you need cross-domain tracking. Without it, each domain creates a new session. A single user looks like three different visitors, and you lose the ability to trace their journey from first click to conversion.
At Tesco, we had analytics running across multiple subdomains and third-party checkout flows. Getting cross-domain tracking right was essential because without it, we couldn’t accurately measure how in-store promotions drove online purchases. Google’s cross-domain measurement documentation covers the technical setup, but the business impact is what matters: without it, you can’t connect the dots.
4. No Data Governance (Hidden Time Cost)
This one doesn’t show up on an invoice, but it’s expensive. Without naming conventions, a data dictionary, and documented processes, your analytics team spends 30-50% of their time just trying to understand what the data means. I’ve seen teams where the only person who knew how a key event was configured had left the company six months earlier.
The DAMA Data Management Body of Knowledge identifies governance as a foundational requirement, yet most marketing analytics teams skip it entirely. The result is tribal knowledge, inconsistent reporting, and a chronic inability to trust the numbers.
5. Over-Collecting Data Without Purpose
More data is not better data. I’ve audited setups that were tracking 400+ custom events, with nobody able to explain why half of them existed. Every unnecessary event you collect increases your storage costs, slows down your reports, and creates GDPR compliance risk if you’re capturing personal data you don’t need.
A good rule: if nobody has looked at a data point in the last 90 days, question whether you should be collecting it at all.
How to Audit Your Analytics Setup
Finding these problems requires a structured audit. I use a three-column approach that covers tags, data quality, and governance. Here’s the checklist I follow with every client.

Step 1: Tag Inventory (2-4 Hours)
Open Google Tag Assistant and crawl your key pages: homepage, product pages, checkout, and thank-you pages. List every tag that fires on each page. You’re looking for duplicates, tags from vendors you no longer use, and tags that fire on the wrong pages.
In your tag management system (GTM, Tealium, or Segment), cross-reference the live tags against your documented tracking plan. If you don’t have a tracking plan, that’s a finding in itself.
Step 2: Data Quality Validation (3-5 Hours)
Use GA4 DebugView to test your key conversion events in real time. Walk through your most important user journey (typically: landing page, product view, add to cart, purchase) and verify that each event fires correctly with the right parameters.
Check your attribution model settings. Compare your GA4 attribution data against your actual payment records. If the numbers diverge by more than 10%, you’ve got an attribution problem.
Step 3: Governance Review (4-8 Hours)
Answer these questions honestly: Do you have a naming convention for events and parameters? Is there a data dictionary that your whole team can access? Does a formal change process exist for modifying tracking? If the answer to any of these is no, you’ve found your governance gaps.
Also check your consent management. With the ICO and GDPR enforcement increasing, Google’s consent mode should be properly implemented. Missing this isn’t just a data quality issue; it’s a legal liability.
The Real ROI of Getting Analytics Right
I want to share a real example from my consulting work. A mid-market e-commerce company (around £8M annual revenue) came to me because their marketing team and finance team couldn’t agree on which channels were profitable. The CEO was losing confidence in the data, and the CMO was making gut-feel decisions because the reports were unreliable.

After a two-week audit, we found: 14 duplicate tags (including three separate Facebook Pixels), a misconfigured enhanced e-commerce setup that was under-reporting revenue by 22%, and zero documentation for any of their 200+ tracked events.
Here’s what changed after fixing those issues:
- Data accuracy went from 55% to 95% (validated against their payment processor)
- Wasted ad spend dropped from 35% to 8% of total budget
- Report trust among leadership jumped from 30% to 89% (measured via internal survey)
- Time to insight fell from 5 days of manual reconciliation to 4 hours with automated dashboards
The total cost of the audit and fixes was around £15,000. The savings in the first year exceeded £200,000 in recovered ad spend alone. That’s a 13x return, and it doesn’t count the value of better decisions made with trustworthy data.
A Simple Framework to Fix Your Analytics Setup
You don’t need to rebuild everything from scratch. I use a three-phase approach that gets results within 6-8 weeks, even for complex setups.

Phase 1: Audit (Weeks 1-2)
Follow the checklist above. Map every data source, identify every problem, and document everything. Don’t fix anything yet. The goal here is to build a complete picture of what’s broken and what it’s costing you.
Your audit report should include a severity rating for each issue (critical, high, medium, low) and an estimated cost impact. This becomes the foundation for getting stakeholder buy-in.
Phase 2: Prioritise (Weeks 2-3)
Rank every issue by two factors: business impact and effort to fix. Start with the quick wins that have high impact and low effort. Duplicate tag removal often falls into this category because you can fix it in an afternoon and immediately stop burning money.
Build a roadmap that your stakeholders can understand. Use language they care about: “This fix will save £X per month” works better than “We need to deduplicate our GTM container.”
Phase 3: Implement (Weeks 3-8)
Execute the fixes in priority order. For each fix, follow a simple process: document the current state, make the change in a staging environment, QA thoroughly, deploy to production, and verify the data looks correct for at least 48 hours before moving on.
The most important step here is QA. I’ve seen companies introduce new problems while fixing old ones because they skipped testing. Use GA4 DebugView and your tag management preview mode for every single change.
Frequently Asked Questions
How much does a broken analytics setup actually cost a business?
For most mid-market companies (£2M-£50M revenue), a broken analytics setup wastes between 20-40% of the analytics investment and leads to 10-30% of ad spend being misallocated. In practice, that translates to tens of thousands of pounds per year in direct costs, plus the harder-to-quantify cost of wrong business decisions.
How often should I audit my analytics setup?
Run a comprehensive audit at least twice per year, and always after major site changes (redesigns, platform migrations, new checkout flows). Set up automated monitoring using tools like ObservePoint or manual spot-checks monthly to catch issues between full audits.
Can I fix analytics problems without hiring a specialist?
You can handle many common fixes in-house if you have someone comfortable with Google Tag Manager and GA4. Duplicate tag removal, basic event configuration, and naming conventions are all DIY-friendly. For complex attribution modelling, cross-domain tracking, or data layer architecture, bringing in a specialist typically pays for itself within the first quarter.
What’s the fastest way to tell if my analytics data is unreliable?
Compare your analytics revenue data against your actual payment processor or accounting records. If the numbers differ by more than 5-10%, you have a data quality problem. Also check your bounce rate: if it’s below 20% or above 90% across the board, something is likely misconfigured (common with duplicate tags).
Should I switch from Universal Analytics to GA4 if I haven’t yet?
Universal Analytics stopped processing data in July 2024, so this isn’t optional. If you’re still relying on UA data or haven’t fully configured GA4, you’re already operating with a data gap. Start with a proper GA4 implementation rather than trying to replicate your old UA setup; the two platforms have fundamentally different data models.
Stop Paying for Bad Data
Your analytics setup is either an asset or a liability. There’s no middle ground. Every day you operate with duplicate tags, wrong attribution, or ungoverned data, you’re making decisions that cost real money.
The fix doesn’t require a massive budget or a year-long project. A structured audit followed by prioritised fixes can transform your analytics from a cost centre into a genuine competitive advantage within 6-8 weeks. I’ve seen it happen at companies of all sizes, from my enterprise work at Deliveroo and Barclays to the startups and mid-market businesses I work with today.
Start with the audit. Find out what your analytics setup is actually costing you. The numbers might surprise you, but they’ll also show you exactly where to focus. If you want help running that audit or fixing what you find, get in touch. I’ve been doing this for 15 years, and the best analytics setup is the one your team actually trusts.